This site uses cookies. By continuing to browse the ConceptDraw site you are agreeing to our Use of Site Cookies.

Value Stream Mapping Symbols

VSM symbols are the best for a production process designing. The entire Value Stream Mapping method uses a graphical representation of the manufacturing process, factors' pros and cons, that all stakeholders can easily understand. Value Stream Mapping is a graphical technique that provides possibilities to improve analysis of a manufacturing process, at the stage of the transferring information or materials that required to deliver a product or service to the customer.

Entity Relationship Diagram Symbols

Creating an entity-relationship (ER) model is to visually represent the structure of a business database, where data equates to entities (or objects) that are linked by defined relationships expressing dependencies and requirements. By nature it is an abstract visualization, the first step in the design process towards creating a logical and functional database.
ERD symbols used for professional ERD drawing are collected in libraries from the Entity-Relationship Diagram (ERD) solution for ConceptDraw PRO.

Accounting Flowchart Symbols

The excellent possibility to create professional-looking Accounting Flowcharts is offered by powerful ConceptDraw PRO software and its Accounting Flowcharts solution. This solution contains wide variety of predesigned accounting flowchart symbols commonly used when representing the flow of data, documents, tasks and people responsible for performance each stage of accounting work process.

Accounting Flowchart Purchasing Receiving Payable and Payment

Accounting flowchart is a pictorial way to represent the flow of data in an organization and the flow of transactions process in a specific area of its accounting or financial department. Accounting Flowcharts solution contains the full set of standardized accounting flowchart symbols which will help you design in minutes various types of Accounting Flowcharts including such popular diagrams which represent the whole accounting process: Purchasing Flowchart, Receiving Flowchart, Voucher Payable Flowchart, Treasurer Flowchart, Payment Flowchart.
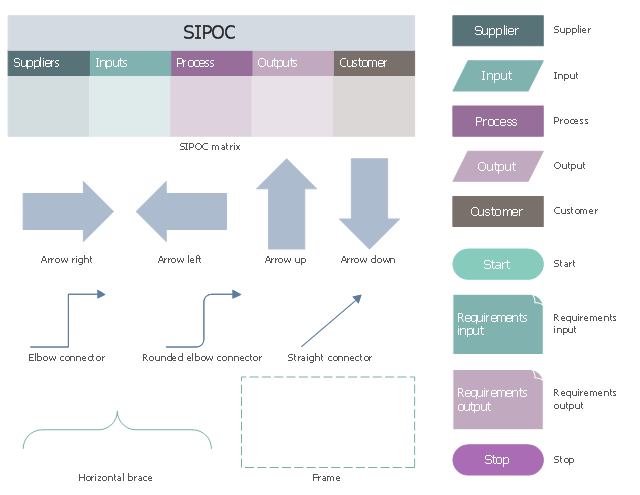
The vector stencils library "SIPOC diagrams" contains 19 symbols.
Use it for business process mapping with ConceptDraw PRO diagramming and business graphics software.
"In process improvement, a SIPOC (sometimes COPIS) is a tool that summarizes the inputs and outputs of one or more processes in table form. The acronym SIPOC stands for suppliers, inputs, process, outputs, and customers which form the columns of the table. It was in use at least as early as the Total Quality Management programs of the late 1980s and continues to be used today in Six Sigma, Lean manufacturing, and business process management." [SIPOC. Wikipedia]
The symbols example "Design elements - SIPOC diagrams" is included in the Business Process Mapping solution from the Business Processes area of ConceptDraw Solution Park.
SIPOC diagram symbols
SIPOC diagram symbols, supplier, straight connector, stop, start, rounded elbow connector, requirements output, requirements input, process, output, input, horizontal brace, frame, elbow connector, customer, arrow up, arrow right, arrow left, arrow down, SIPOC matrix,

ERD Symbols and Meanings

Crow's foot notation is used in Barker's Notation, Structured Systems Analysis and Design Method (SSADM) and information engineering. Crow's foot diagrams represent entities as boxes, and relationships as lines between the boxes. Different shapes at the ends of these lines represent the cardinality of the relationship.
The Chen's ERD notation is still used and is considered to present a more detailed way of representing entities and relationships.
To create an ERD, software engineers mainly turn to dedicated drawing software, which contain the full notation resources for their specific database design - ERD symbols and meanings. CS Odessa has released an all-inclusive Entity-Relationship Diagram (ERD) solution for their powerful drawing program, ConceptDraw PRO.
How to Build an Entity Relationship Diagram (ERD)

Process Flowchart

ConceptDraw is Professional business process mapping software for making process flow diagram, workflow diagram, general flowcharts and technical illustrations for business documents. It is includes rich examples, templates, process flowchart symbols. ConceptDraw flowchart maker allows you to easier create a process flowchart. Use a variety of drawing tools, smart connectors, flowchart symbols and shape libraries to create flowcharts of complex processes, process flow diagrams, procedures and information exchange.
How To Create a Process Flow Chart (business process modelling techniques)

Graphical Symbols to use in EPC diagrams

Event-Driven Process Chain Diagrams for improvement throughout an organisation.
ConceptDraw PRO - software that reduces the time needed to create a business process model.

Purchasing Flowchart - Purchase Order. Flowchart Examples

Create your own flow charts of purchasing business processes using the ConceptDraw PRO diagramming and vector drawing software extended with the Accounting Flowcharts solution from the Finance and Accounting area of ConceptDraw Solution Park.
The flow chart example shows the steps of purchasing business process.

Value Stream Mapping Icons

The library with 40 vector stencils is included in the ConceptDraw Value Stream Mapping solution.