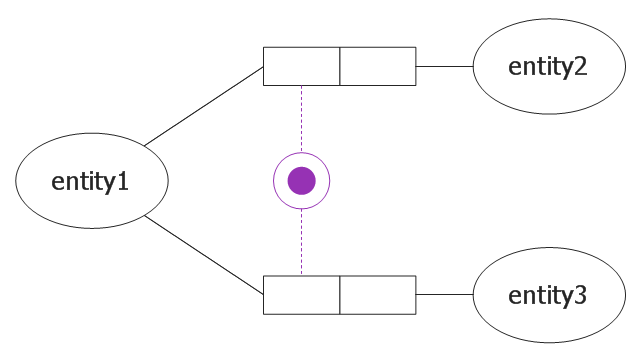
This object-role modeling (ORM) diagram sample shows disjunctive mandatory role constraint.
It was designed on the base of the Wikimedia Commons file: 9 DisjunktyvusPrivalomumoRibojimas.jpg. [commons.wikimedia.org/ wiki/ File:9_ DisjunktyvusPrivalomumoRibojimas.jpg]
"2.7. Mandatory Role Constraints.
The ORM 1 tool indicates simple mandatory constraints by a solid dot either (a) at the intersection of an entity type shape and the line connecting it to a role, or (b) at the role end. Option (b) is needed to avoid ambiguity when an object type plays many mandatory roles whose connections to the object type are too close to distinguish which role the dot applies to. Currently, disjunctive mandatory (inclusive-or) constraints are depicted by placing the solid dot in a circle connected by dotted lines to the roles it applies to. ORM 2 retains this notation, except that the solid dot is consistently colored violet and a global configuration option determines the default placement of simple mandatory dots at the role or object type end. Users may override this global setting on an individual role basis." [www.orm.net/ pdf/ ORM2_ TechReport1.pdf]
The object-role model example "Disjunctive mandatory constraint ORM diagram" was designed using ConceptDraw PRO software extended with ORM Diagrams solution from Software Development area of ConceptDraw PRO Solution Park.
Object role modeling
 Object-Role Modeling (ORM) Diagrams
Object-role Modeling (ORM) Diagram solution with powerful vector diagramming and data modeling tools, large quantity of specially developed samples and examples, and rich variety of vector objects corresponding to common ORM notation, ideally suits for developing the comprehensive, clear and visual Object-role Modeling (ORM) diagrams and schematics, understandable for all interested people from the different fields and business directions, for designing the ORM models, and demonstrating advantages from the use of ORM and its notation. It is intended for software developers and computer engineers, specialists in a field of Object-oriented programming (OOP), database architects, web-application constructors and developers, etc.
IDEF4 Standard

This object-role modeling (ORM) diagram sample shows model of employee data: birthdate, hiredate, rank, company car number. It was designed on the base of the Wikimedia Commons file: ORM-diagram-tkz-orm.png. [commons.wikimedia.org/ wiki/ File:ORM-diagram-tkz-orm.png]
"Facts.
Object-role models are based on elementary facts, and expressed in diagrams that can be verbalised into natural language. ...
This "fact-based" approach facilitates modeling, transforming, and querying information from any domain. ...
Attribute-free.
ORM is attribute-free: unlike models in the entity–relationship (ER) and Unified Modeling Language (UML) methods, ORM treats all elementary facts as relationships and so treats decisions for grouping facts into structures (e.g. attribute-based entity types, classes, relation schemes, XML schemas) as implementation concerns irrelevant to semantics. By avoiding attributes in the base model, ORM improves semantic stability and enables verbalization into natural language. ...
Fact-based modeling.
Fact-based modeling includes procedures for mapping facts to attribute-based structures, such as those of ER or UML. ...
Fact-based graphical notations are more expressive than those of ER and UML. ...
Design procedure.
System development typically involves several stages such as: feasibility study; requirements analysis; conceptual design of data and operations; logical design; external design; prototyping; internal design and implementation; testing and validation; and maintenance." [Object-role modeling. Wikipedia]
The object-role modeling diagram example "Employee ORM diagram" was designed using ConceptDraw PRO software extended with ORM Diagrams solution from Software Development area of ConceptDraw PRO Solution Park.
Object-role model
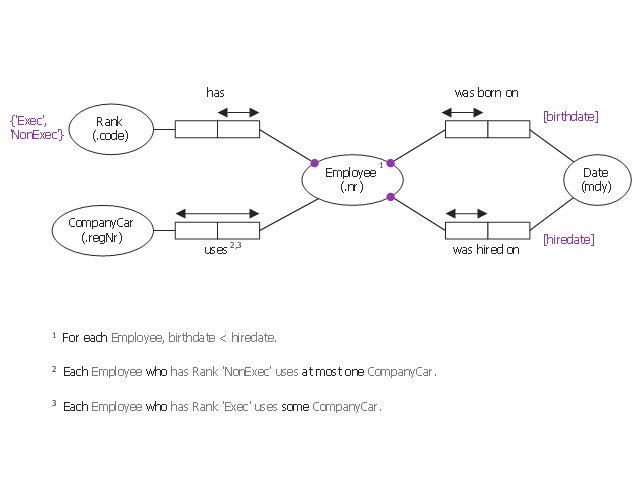
Diagram Software - The Best Choice for Diagramming

Best Diagramming


Drawing Workflow Diagrams

Flow Diagrams

UML Use Case Diagram. Design Elements


 Interactive Voice Response Diagrams
Interactive Voice Response Diagrams solution extends ConceptDraw DIAGRAM software with samples, templates and libraries of ready-to-use vector stencils that help create Interactive Voice Response (IVR) diagrams illustrating in details a work of interactive voice response system, the IVR system’s logical and physical structure, Voice-over-Internet Protocol (VoIP) diagrams, and Action VoIP diagrams with representing voice actions on them, to visualize how the computers interact with callers through voice recognition and dual-tone multi-frequency signaling (DTMF) keypad inputs.
 Timeline Diagrams
Timeline Diagrams solution extends ConceptDraw DIAGRAM diagramming software with samples, templates and libraries of specially developed smart vector design elements of timeline bars, time intervals, milestones, events, today marker, legend, and many other elements with custom properties, helpful for professional drawing clear and intuitive Timeline Diagrams. Use it to design simple Timeline Diagrams and designate only the main project stages, or highly detailed Timeline Diagrams depicting all project tasks, subtasks, milestones, deadlines, responsible persons and other description information, ideal for applying in presentations, reports, education materials, and other documentation.
 Cloud Computing Diagrams
The Cloud Computing Diagrams solution extends the functionality of the ConceptDraw DIAGRAM diagramming software with a comprehensive collection of libraries of commonly accepted cloud computing vector stencils to help you to get started designing Cloud Computing Diagrams, Architecture Diagrams and Cloud Computing Architecture Diagrams without effort. This solution lets one professionally depict the way how the cloud computing works, allows giving a powerful introduction to the Cloud computing architecture and Amazon cloud computing architecture, to display the essence of the cloud computing, the main characteristics and classification of the cloud services thanks to the wide variety of predesigned samples and examples.
 EXPRESS-G data Modeling Diagram
EXPRESS-G data Modeling Diagram solution extends the ConceptDraw DIAGRAM software functionality with capabilities of EXPRESS data modeling language, includes powerful data modeling tools, Express-G diagram tool, database diagram tool, database design tool, wide variety of pre-made vector objects of EXPRESS-G notation and EXPRESS-G diagrams samples allowing software developers, software designers, software engineers and other stakeholders to make their data models for information systems, to develop the databases, to learn the principles of construction EXPRESS-G diagrams and helping to draw their own EXPRESS-G Data Modeling Diagrams, Express-G Diagrams or Database Model Diagram without any efforts.
P&ID Diagram Software

 Business Diagrams
The Business Diagrams Solution extends ConceptDraw DIAGRAM with an extensive collection of professionally designed illustrative samples and a wide variety of vector stencils libraries, which are the real help for all business-related people, business analysts, business managers, business advisers, marketing experts, PR managers, knowledge workers, scientists, and other stakeholders allowing them to design the bright, neat, expressive and attractive Bubble Diagrams, Circle-Spoke Diagrams, Circular Arrows Diagrams, and Venn Diagrams with different quantity of sets in just minutes; and then successfully use them in documents, reports, statistical summaries, and presentations of any style.
Powerful Drawing Feature for Creating Professional Diagrams

Workflow Flowchart Symbols

PERT Chart Software

 HR Flowcharts
The HR Flowcharts solution is ideal for using while creating the HR-related drawings in the ConceptDraw DIAGRAM charting and drawing software, providing with a comprehensive collection of human resources themed icons, connectors, and images from the available stencil libraries, helping illustrating flowcharts, infographics and workflow diagrams.
 Network Layout Floor Plans
Network Layout Floor Plans solution extends ConceptDraw DIAGRAM software functionality with powerful tools for quick and efficient documentation the network equipment and displaying its location on the professionally designed Network Layout Floor Plans. Never before creation of Network Layout Floor Plans, Network Communication Plans, Network Topologies Plans and Network Topology Maps was not so easy, convenient and fast as with predesigned templates, samples, examples and comprehensive set of vector design elements included to the Network Layout Floor Plans solution. All listed types of plans will be a good support for the future correct cabling and installation of network equipment.
- Object-Role Modeling (ORM) Diagrams | Design elements - ORM ...
- UML Diagram | Diagramming Software for Design UML Use Case ...
- Matrix Organization Structure | Pyramid Diagram and Pyramid Chart
- Network Diagram Software . LAN Network Diagrams . Physical Office ...
- Technical Drawing Software | Electrical Symbols, Electrical Diagram ...
- Site Plans | Mind Mapping Software | Electrical Symbols, Electrical ...
- UML Tool & UML Diagram Examples | How To Draw Building Plans ...
- Electrical Symbols, Electrical Diagram Symbols | Technical Drawing ...
- Home Electrical Plan | How To use House Electrical Plan Software ...
- Manufacturing and Maintenance | Circuits and Logic Diagram ...