Sample Project Flowchart. Flowchart Examples
This sample shows the Flowchart that displays the architecture of SQL Exception Translation. This sample was created in ConceptDraw PRO diagramming and vector drawing software using the Flowcharts solution from the Diagrams area of ConceptDraw Solution Park.
ConceptDraw PRO Compatibility with MS Visio
The powerful diagramming and business graphics tools are now not exception, but the norm for today’s business, which develop in incredibly quick temp. But with the abundance of powerful business diagramming applications it is important to provide their compatibility for effective exchange the information between the colleagues and other people who maybe use different software in their work. During many years Microsoft Visio™ was standard file format for the business and now many people need the visual communication software tools that can read the Visio format files and also export to Visio format. The powerful diagramming and vector drawing software ConceptDraw PRO is ideal from the point of view of compatibility with MS Visio. Any ConceptDraw PRO user who have the colleagues that use MS Visio or any who migrates from Visio to ConceptDraw PRO, will not have any problems. The VSDX (Visio′s open XML file format) and VDX formatted files can be easily imported and exported by ConceptDraw PRO, you can see video about this possibility.Total Quality Management with ConceptDraw
Total Quality Management (TQM) system is the management method where the confidence in quality of all organization processes is placed foremost. The given method is widely used in production, in educational system, in government organizations and so on.BCG Matrix
The growth–share matrix (BCG Matrix) was created by Bruce D. Henderson for the Boston Consulting Group in 1970 to help corporations to analyze their business units and to help the company allocate resources. How is it easy design the BCG Matrices in ConceptDraw PRO diagramming and vector drawing software supplied with unique Matrices Solution from the Marketing Area of ConceptDraw Solution Park.Scrum workflow
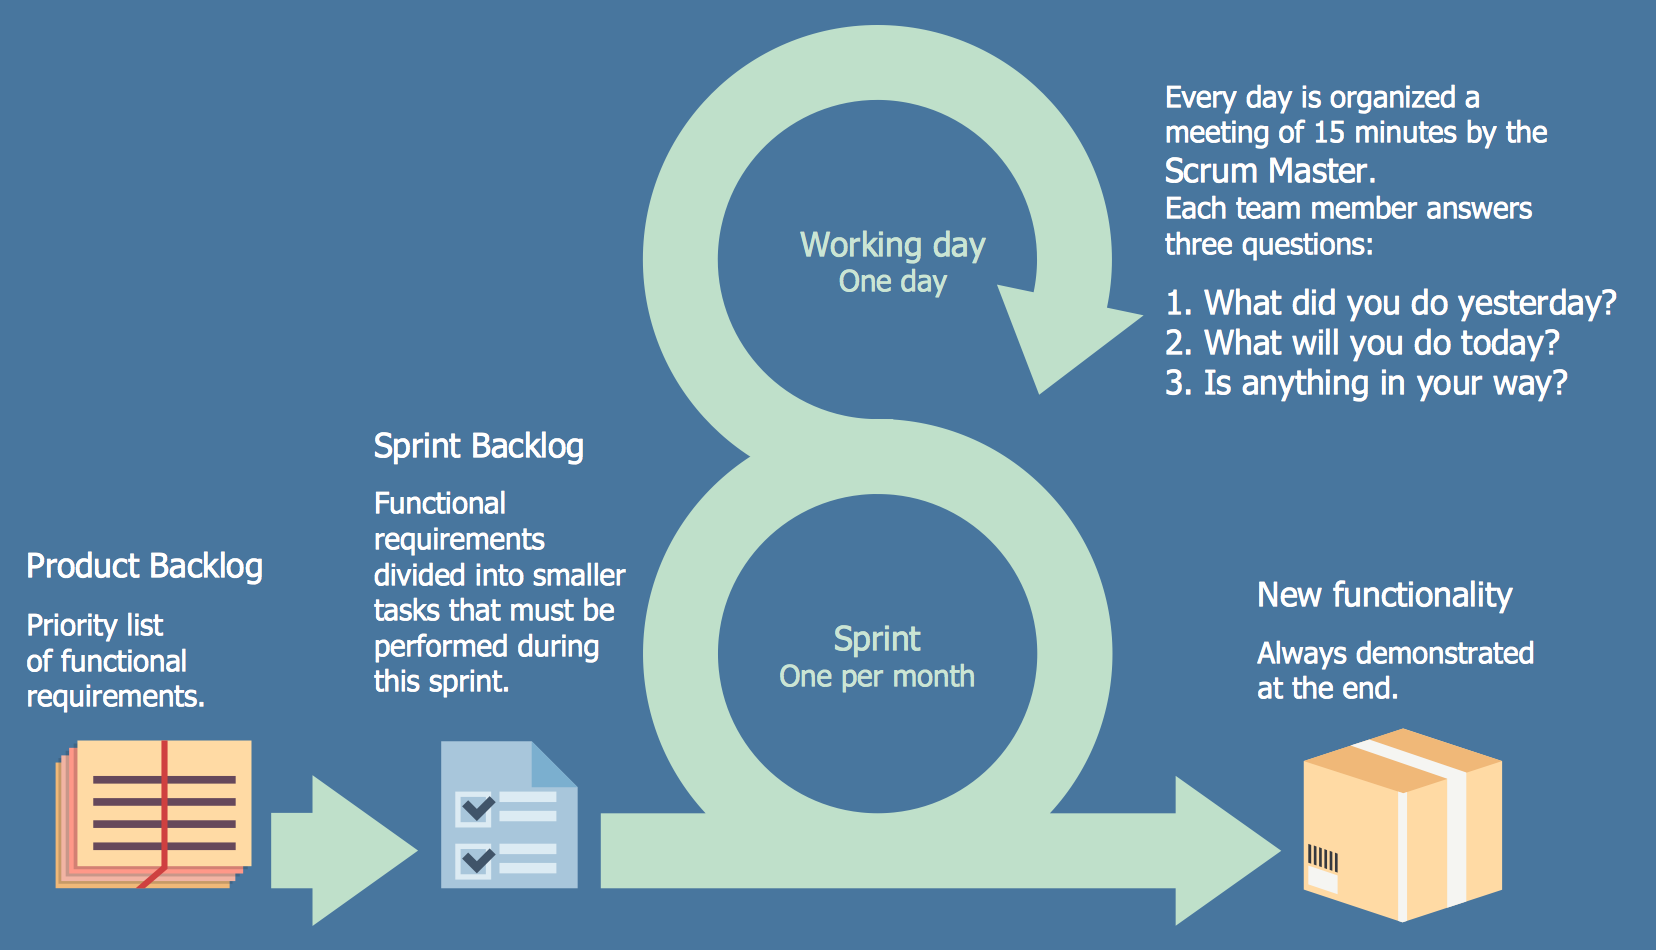
ConceptDraw PRO diagramming and vector drawing software extended with unique SCRUM Workflow solution from the Project Management area of ConceptDraw Solution Park allows fast and easy design professional-looking Scrum Workflow Diagrams and Scrum workflow scheme for projects required when working on projects and managing them, when developing software with cutting-edge Agile methodologies.Quality Management System
ConceptDraw PRO diagramming and vector drawing software extended with Total Quality Management (TQM) Diagrams solution from the Quality area of ConceptDraw Solution Park perfectly suits for development and visually representing a Quality Management System.Pie Chart Examples and Templates
A pie chart or a circle graph is a circular chart divided into sectors, illustrating numerical proportion. In a pie chart, the arc length of each sector and consequently its central angle and area, is proportional to the quantity it represents. Pie chart examples and templates created using ConceptDraw PRO software helps you get closer with pie charts and find pie chart examples suite your needs.Work Flow Process Chart
Workflow Diagram - workflow process diagram is a visual representation of a organizational process flow. Often it used as the same visual notation as process flow diagram. Visualising business processes using workflow diagram (workflow process diagram) allows estimate business process efficiency, analyse and optimize the process itself. Workflow diagram helps get focusing on each step and relations between workflow steps. ConceptDraw PRO is software for making workflow diagram. It contains specific designed graphics to draw workflow diagrams effectively. This is workflow diagram maker which do your work process effective.Venn Diagram Template
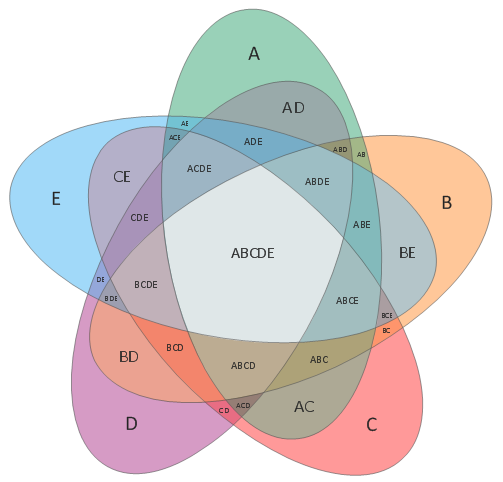
It's impossible to overestimate the usefulness and convenience of using the ready templates when you create your own diagrams and charts. And Venn Diagrams are not exception. ConceptDraw PRO diagramming and vector drawing software presents the Venn Diagrams solution from "Diagrams" area which offers a set of Venn Diagram templates and samples. Use the suitable Venn Diagram Template to create your own Venn Diagram of any complexity.Flow chart Example. Warehouse Flowchart
Warehouse Flowcharts are various diagrams that describe the warehousing and inventory management processes on the warehouses. Typical purposes of Warehouse Flowcharts are evaluating warehouse performance, measuring efficiency of customer service and organizational performance. This type of Workflow diagrams can be used for identifying any disconnection between business activities and business objectives. They are effectively used by warehouse-related people and organizations, manufacturers, wholesalers, exporters, importers, transporters, and others. Standard Warehousing process flow diagram and standard Workflow diagram are used for process identification for further evaluating effectiveness and profitability of overall business process. Use the ConceptDraw PRO vector graphic software extended with Flowcharts solution to design your own professional-looking Workflow diagrams and Flowcharts of any types, including the Warehouse flowchart, Process flow diagrams which depict in details all steps of Warehouse packages flow. Microsoft Visio, designed for Windows users, can’t be opened directly on Mac. But fortunately, there are several Visio alternatives for Mac which will help Mac users to work Visio files. With ConceptDraw PRO, you may open, edit and save files in Visio format.
Flowchart Software
The Flowcharts are popular and widely used for designing, documenting, managing and analyzing the complex processes and programs in various fields, such as science, business, engineering, architecture, manufacturing, administration, and many others. To design professional looking Flowchart Diagrams we recommend to use the ConceptDraw PRO diagramming and vector drawing software extended with set of Flowchart maker solutions from the Diagrams, Finance and Accounting, Marketing, and Business Processes areas of ConceptDraw Solution Park. ConceptDraw PRO flowchart software is rich for the libraries of ready-to-use predesigned vector flowchart objects, templates, samples and examples, which make it the best choice for designing the Flowcharts of any type and style. Besides, the ConceptDraw documents with Flowchart Diagrams are vector graphic documents, available for reviewing, modifying and converting to different popular formats: image, HTML, PDF file, MS PowerPoint Presentation, Adobe Flash or MS Visio XML.Donut Chart Templates
These donut chart templates was designed using ConceptDraw PRO diagramming and vector drawing software extended with Pie Charts solution from Graphs and Charts area of ConceptDraw Solution Park. All these donut chart templates are included in the Pie Charts solution. You can quickly rework these examples into your own charts by simply changing displayed data, title and legend texts.
 Wireless Networks
The Wireless Networks Solution extends ConceptDraw PRO software with professional diagramming tools, set of wireless network diagram templates and samples, comprehensive library of wireless communications and WLAN objects to help network engineers and designers efficiently design and create Wireless network diagrams that illustrate wireless networks of any speed and complexity, and help to identify all required equipment for construction and updating wireless networks, and calculating their costs.
EPC
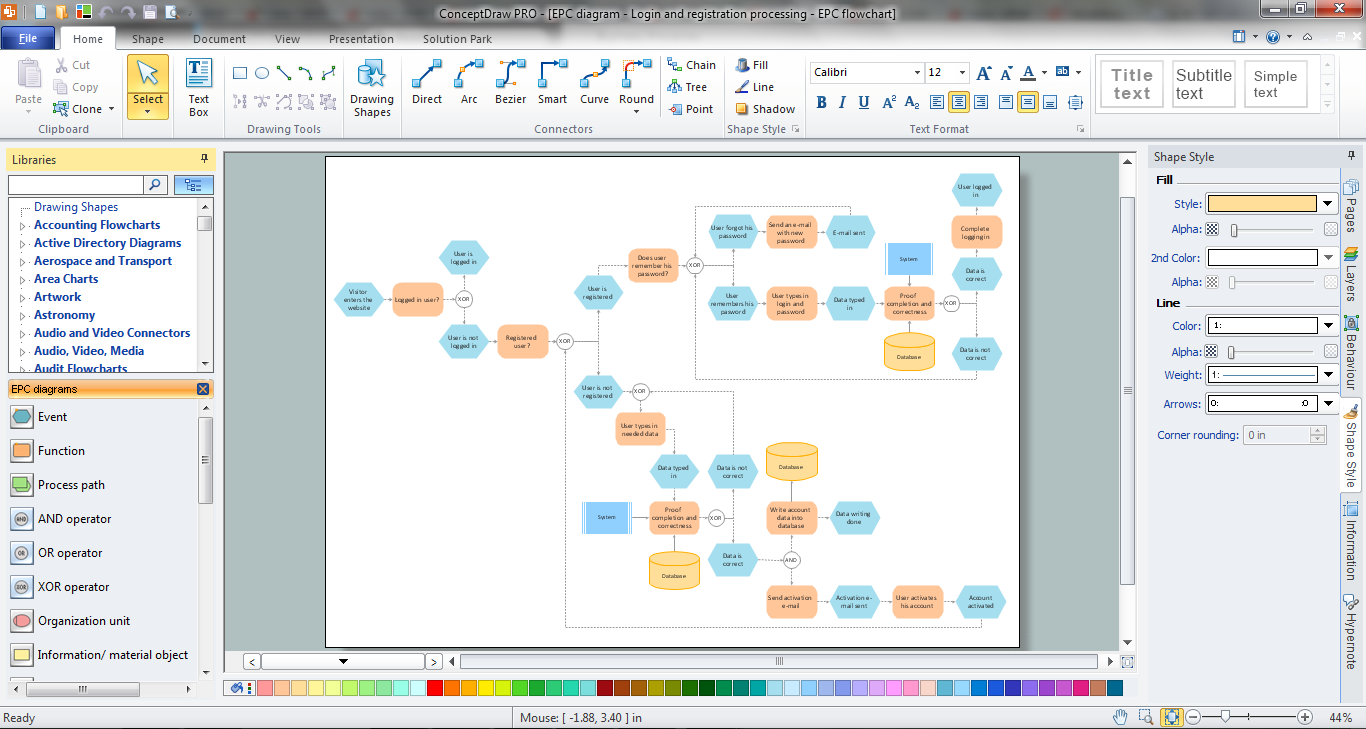
How do you make usually the EPC diagrams? It is quite complex and lengthy process. But now thanks to the ConceptDraw PRO diagramming and vector drawing software extended with Event-driven Process Chain Diagrams EPC solution from the Business Processes area of ConceptDraw Solution Park this process became simple and fast.Map of Germany — North Rhine-Westphalia State
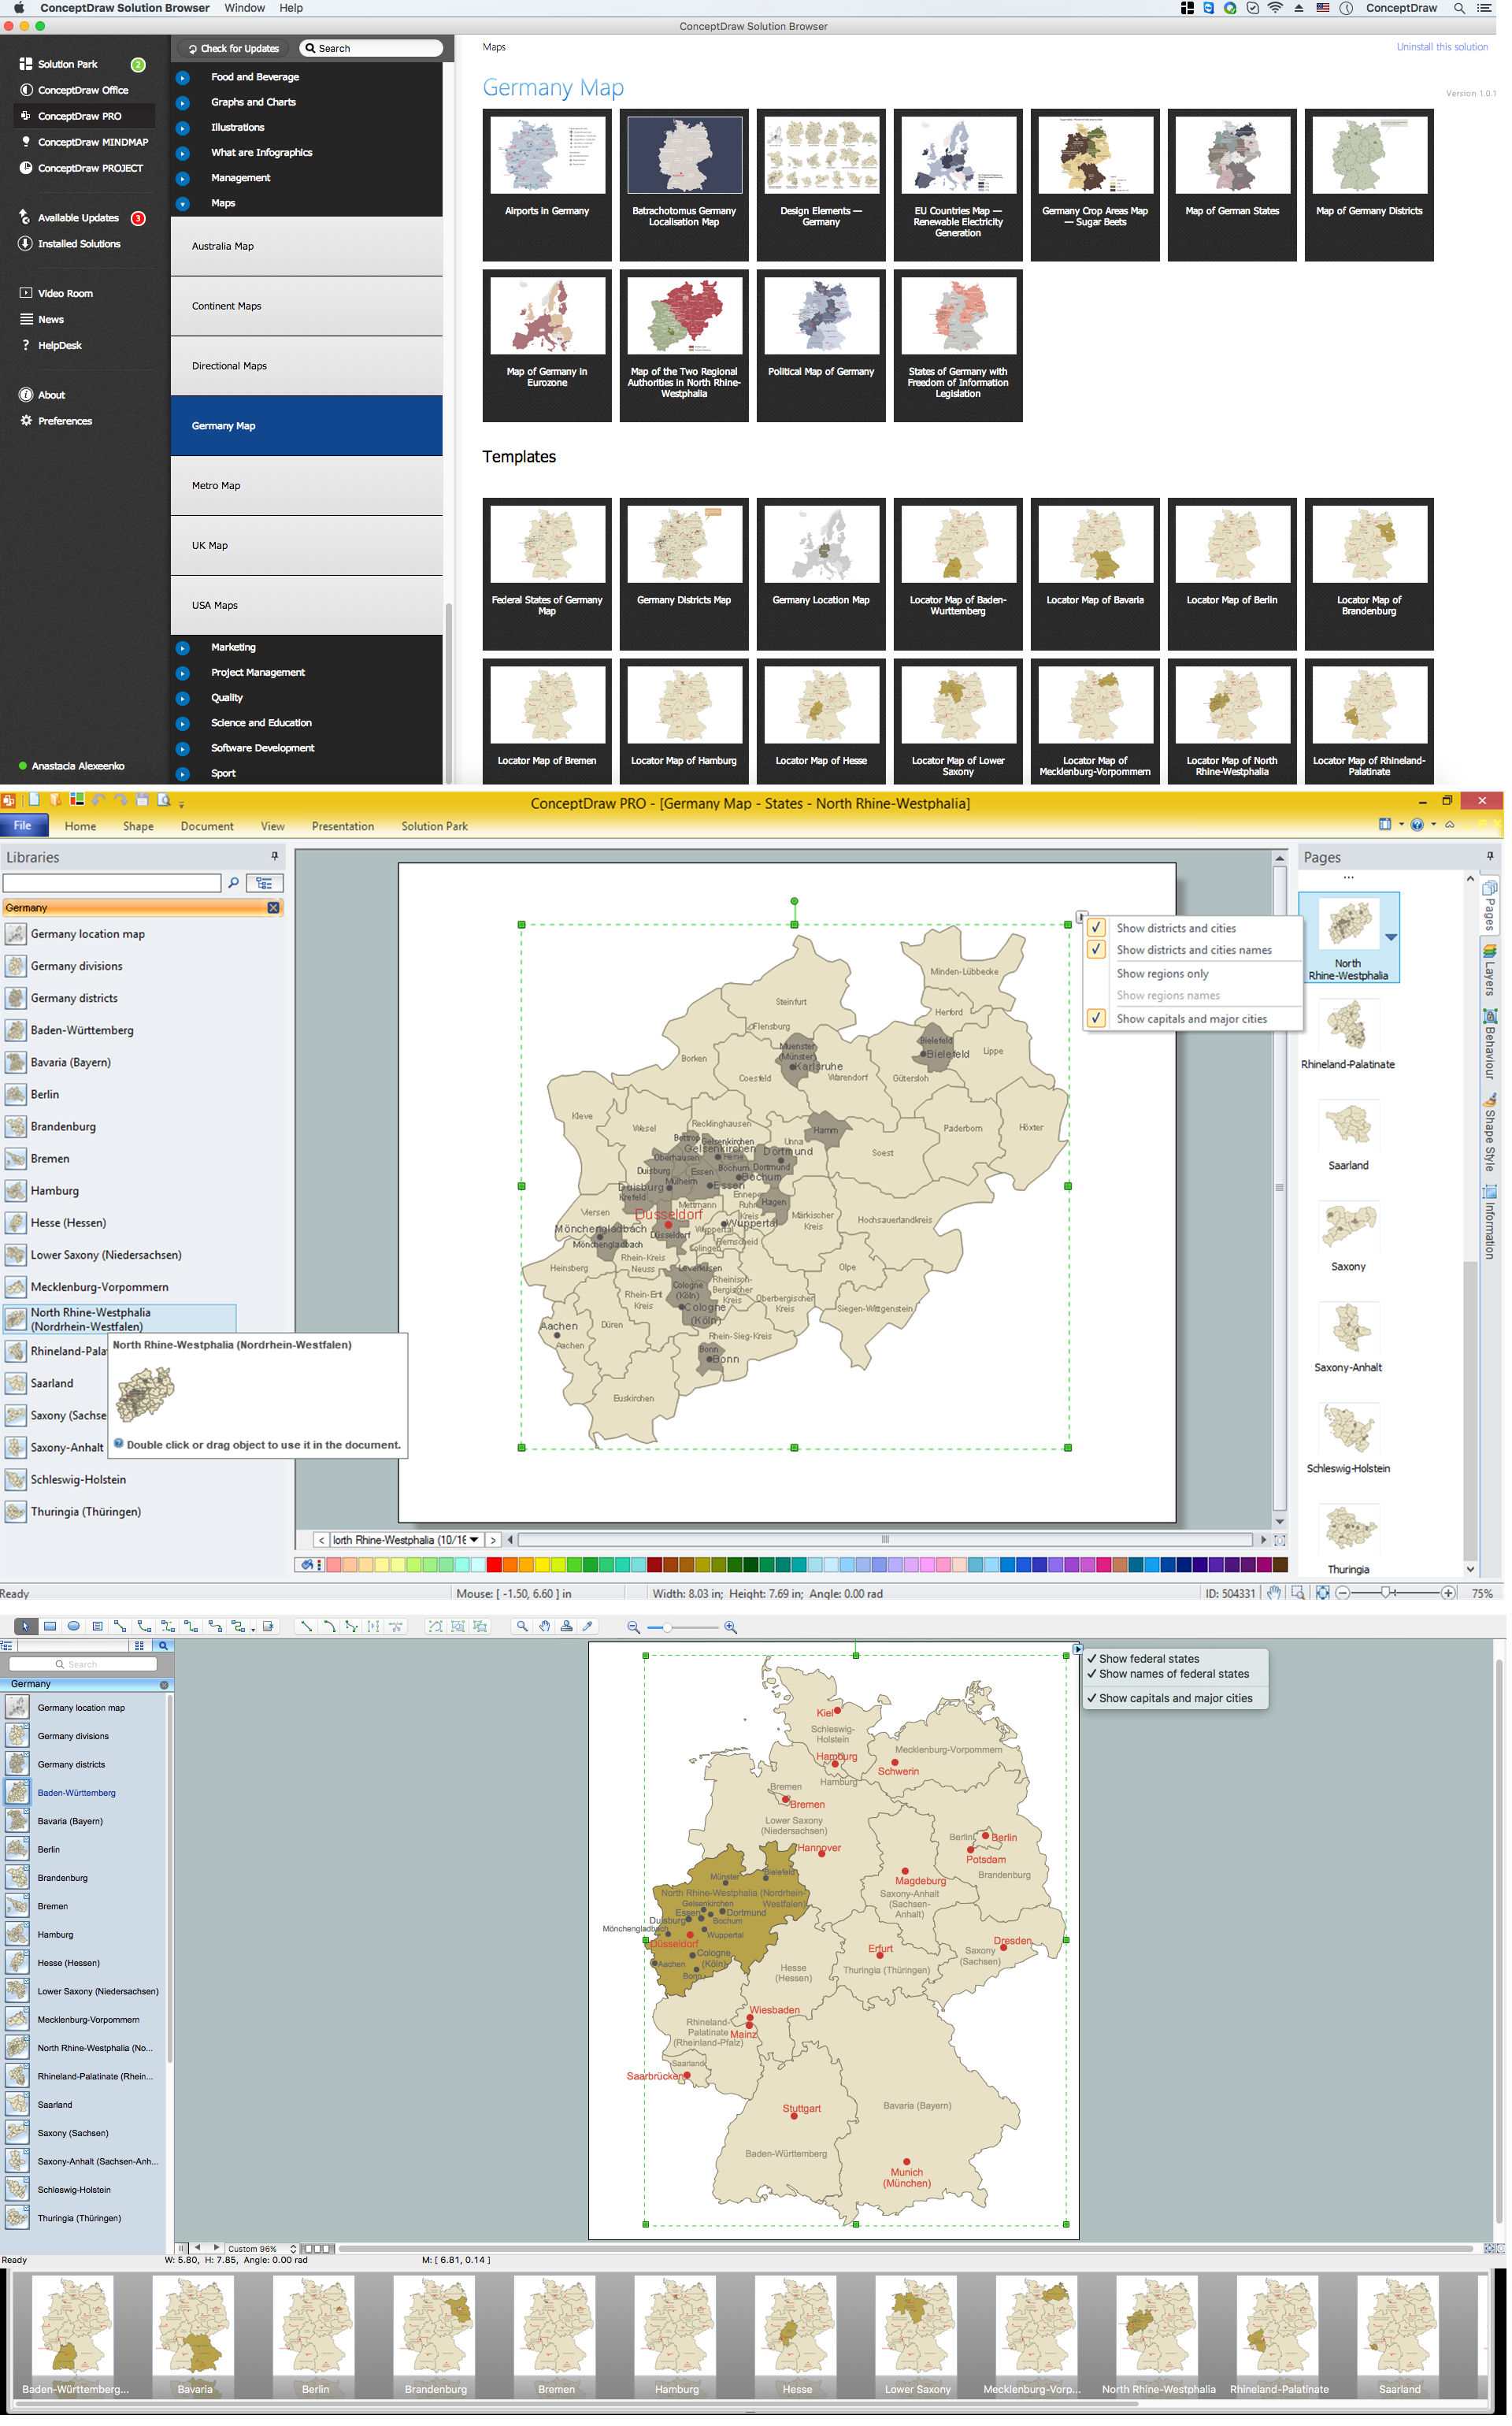
North Rhine-Westphalia is the most populous state of Germany, as well as the fourth largest by area. Its capital is Düsseldorf; the biggest city is Cologne. Despite the fact that the maps surround us everywhere in our life, usually the process of their drawing is sufficienly complex and labor-intensive. But now, thanks to the ConceptDraw PRO diagramming and vector drawing software extended with Germany Map Solution from the Maps Area of ConceptDraw Solution Park, we have the possibility to make easier this process. Design fast and easy your own pictorial maps of Germany, map of Germany with cities, and thematic Germany maps in ConceptDraw PRO!- Management By Exception Flow Chart
- Process Flowchart | Types of Flowchart - Overview | Basic Flowchart ...
- Performance Indicators | PM Dashboards | Design elements - Sales ...
- Project management life cycle - Flowchart | Process Flowchart ...
- Project management life cycle - Flowchart | Sample Project ...
- School Management Structure In A Flow Diagram
- Sample Project Flowchart. Flowchart Examples | Flowchart ...
- School Management Project Algorithm And Flowchart
- Sample Project Flowchart. Flowchart Examples | Flowchart ...
- Basic Audit Flowchart. Flowchart Examples | Basic Flowchart ...
- UML sequence diagram - Ticket processing system | UML sequence ...
- Software Work Flow Process in Project Management with Diagram ...
- Sample Project Flowchart. Flowchart Examples | Flowchart ...
- Prepare A Flow Chart Of Management Structure Of The School
- How to Open Visio® VDX File Using ConceptDraw PRO | How to ...
- Project management life cycle - Flowchart
- Management Flow Chart Examples
- Flowchart Programming Project. Flowchart Examples | Sample ...
- Diagram Viewer Online Help | How to Open MS Visio® 2013/2016 ...
- ConceptDraw PRO Compatibility with MS Visio | How to Open MS ...


