This site uses cookies. By continuing to browse the ConceptDraw site you are agreeing to our Use of Site Cookies.

Basic Flowchart Symbols and Meaning

Flowchart Symbols and Meaning - Provides a visual representation of basic flowchart symbols and their proposed use in professional workflow diagram, standard process flow diagram and communicating the structure of a well-developed web site, as well as their correlation in developing on-line instructional projects. See flowchart's symbols by specifics of process flow diagram symbols and workflow diagram symbols.
How to Build a Flowchart

Bus Network Topology

The Computer and Networks solution from Computer and Networks area of ConceptDraw Solution Park provides examples, templates and vector stencils library with symbols of local area network (LAN) and wireless LAN (WLAN) equipment.
Use it to draw the physical and logical network topology diagrams for wired and wireless computer communication networks.
Create your bus network topology diagrams using the ConceptDraw PRO.

Flow chart Example. Warehouse Flowchart

Warehouse Flowcharts are different diagrams describing wharehousing and inventory menagement processes. Typical purposes of warehouse flowcharts are evaluating warehouse performance and organizational performance, measuring efficiency of customer service. This type of workflow diagrams can be used for identifying any disconnection between business activities and business objectives.
Standard warehousing process flow diagram and standard workflow diagram used for process identification for further evaluating effectiveness and profitability of overall business process. Use the ConceptDraw PRO diagramming and vector drawing software extended with the Flowcharts solution from the Diagrams area of ConceptDraw Solution Park to design your own workflow diagrams, process flow diagram and flow charts. Need to use Process Flow Diagram for designing Warehouse packages flow.
ConceptDraw Arrows10 Technology
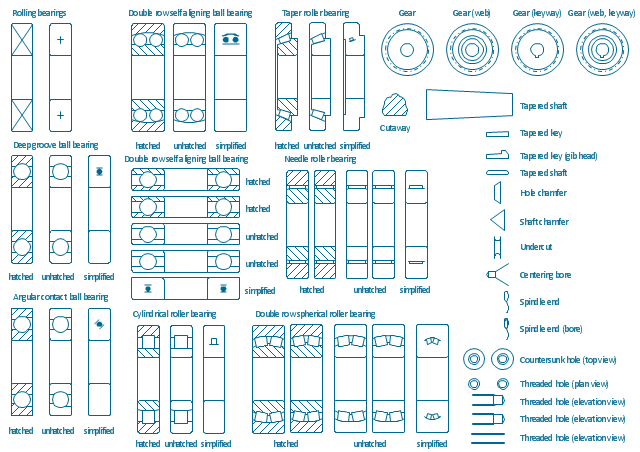
The vector stencils library "Bearings" contains 59 symbols of ball bearings, roller bearings, shafts, springs, gears, hooks, spindles, and keys.
Use it to design engineering drawings of machine tools and mechanical devices.
"A bearing is a machine element that constrains relative motion and reduce friction between moving parts to only the desired motion. The design of the bearing may, for example, provide for free linear movement of the moving part or for free rotation around a fixed axis; or, it may prevent a motion by controlling the vectors of normal forces that bear on the moving parts. Many bearings also facilitate the desired motion as much as possible, such as by minimizing friction. Bearings are classified broadly according to the type of operation, the motions allowed, or to the directions of the loads (forces) applied to the parts." [Bearing (mechanical). Wikipedia]
The shapes example "Design elements - Bearings" was created using the ConceptDraw PRO diagramming and vector drawing software extended with the Mechanical Engineering solution from the Engineering area of ConceptDraw Solution Park.
Bearing symbols
Bearing symbols, undercut, shaft, variable fillet radius, thrust ball bearing, through hole, threaded hole, tapered shaft, tapered key, gib head, taper roller bearing, roller bearing, spindle end, shaft, hollow shaft, shaft chamfer, chamfer, round key, round-end key, rolling bearing, needle roller bearing, roller bearing, hole chamfer, chamfer, gear, spur-gear, double row, spherical roller bearing, roller bearing, double row, self aligning, ball bearing, deep groove, ball bearing, cylindrical roller bearing, roller bearing, cutaway, revealing detail, countersunk hole, centering bore, hole, shaft, angular contact, ball bearing,

UML Block Diagram

Use Case Diagram Taxi Service UML. This sample was created in ConceptDraw PRO diagramming and vector drawing software using the UML Use Case Diagram library of the Rapid UML Solution from the Software Development area of ConceptDraw Solution Park.
This sample shows the work of the taxi service and is used by taxi stations, by airports, in the tourism field and delivery service.

Sales Process Flowchart. Flowchart Examples

Create your own flow charts of sales business processes using the ConceptDraw PRO diagramming and vector drawing software extended with the Cross-Functional Flowcharts solution from the Business Processes area or Sales Flowcharts from the Marketing area of ConceptDraw Solution Park.

Venn Diagram Examples for Problem Solving. Computer Science. Chomsky Hierarchy

A Venn diagram, sometimes referred to as a set diagram, is a diagramming style used to show all the possible logical relations between a finite amount of sets. In mathematical terms, a set is a collection of distinct objects gathered together into a group, which can then itself be termed as a single object. Venn diagrams represent these objects on a page as circles or ellipses, and their placement in relation to each other describes the relationships between them.
The Venn diagram example below visualizes the the class of language inclusions described by the Chomsky hierarchy.

Business Process Flow Diagram

Business Process Flow Diagram is a graphical presentation of business processes and process flows. It is one of the main tool of business analysis and business process re-engineering that lets identify and easy understand process flows within organization.
ConceptDraw PRO extended with Business Process Workflow Diagrams solution from the Business Processes area of ConceptDraw Solution Park is a powerful software which lets easy design Business Process Flow Diagram of any complexity.

Workflow Diagram Data

Workflow Diagram created by using special software based on graphic mastering technology Arrows10. Its automatics follows the global concept of business graphics and diagramming. The practical effectiveness of Arrows10 technology used in ConceptDraw PRO are around the quick auto-arrows behaving as expected and connecting boxes of workflow diagram from workflow symbol to process flow symbol.

ConceptDraw PRO is a workflow diagram software contains specific features help you to draw diagrams faster, such as RapidDraw, or Arrows10. There is also a rich set of samples and templates to give you an example of data may be visualized as workflow diagram.

Value Stream Mapping Symbols

VSM symbols are the best for a production process designing. The entire Value Stream Mapping method uses a graphical representation of the manufacturing process, factors' pros and cons, that all stakeholders can easily understand. Value Stream Mapping is a graphical technique that provides possibilities to improve analysis of a manufacturing process, at the stage of the transferring information or materials that required to deliver a product or service to the customer.