Structured Systems Analysis and Design Method (SSADM) with ConceptDraw DIAGRAM

SSADM Diagram

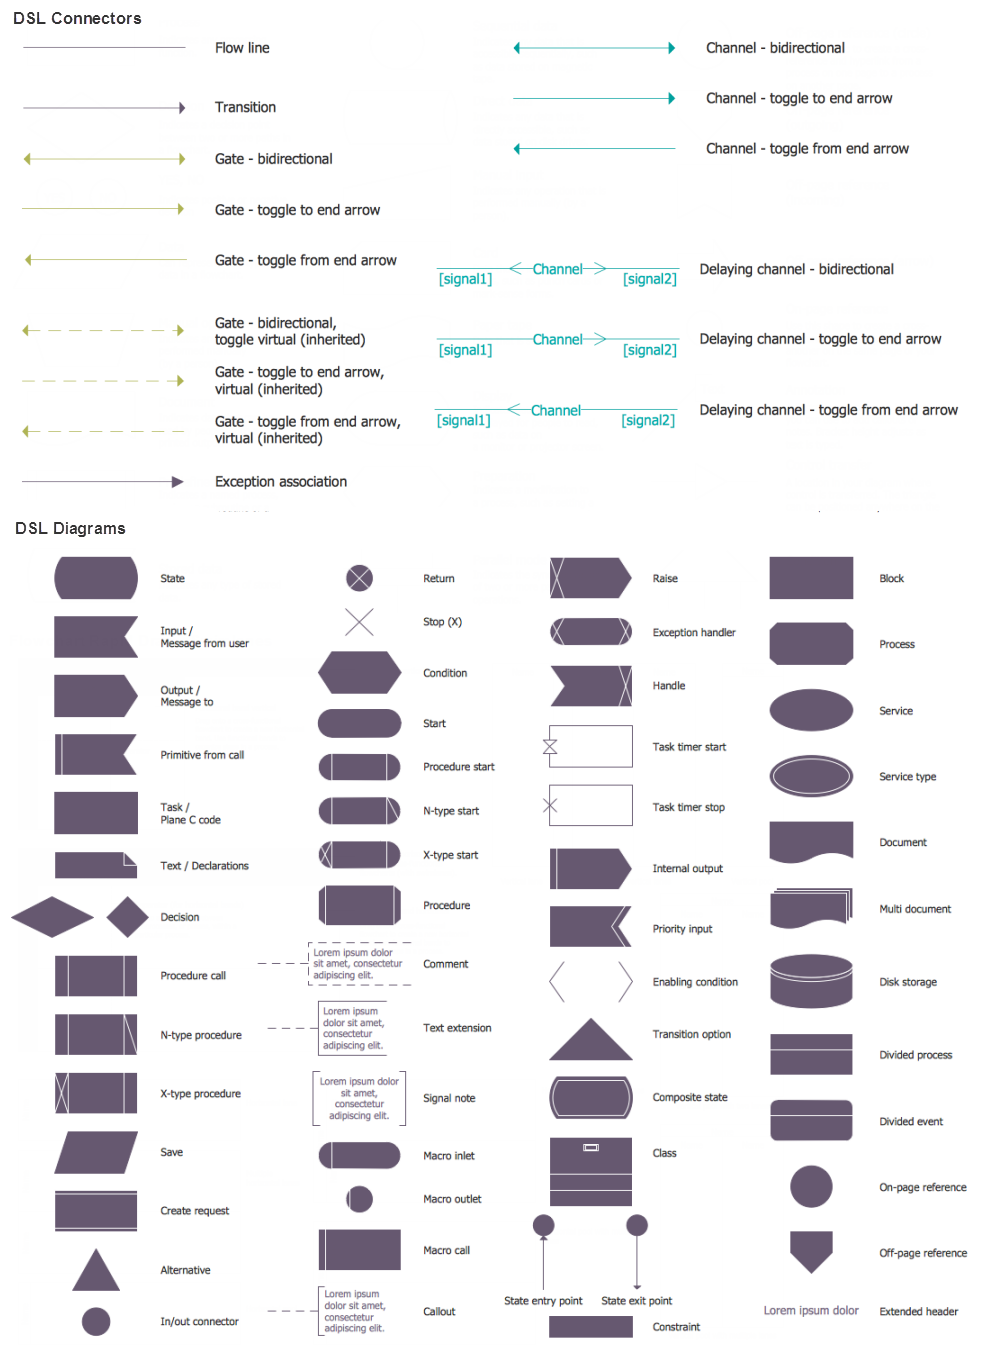
 Specification and Description Language (SDL)
For people in the field of systems engineering or system design, working with specification and description language (sdl) and finite state machines (fsm).
System Design
UML Diagram

Process Flowchart


 Data Flow Diagrams (DFD)
Data Flow Diagrams solution extends ConceptDraw DIAGRAM software with templates, samples and libraries of vector stencils for drawing the data flow diagrams (DFD).
Entity Relationship Diagram Examples


 Computer Network Diagrams
Computer Network Diagrams solution extends ConceptDraw DIAGRAM software with samples, templates and libraries of vector icons and objects of computer network devices and network components to help you create professional-looking Computer Network Diagrams, to plan simple home networks and complex computer network configurations for large buildings, to represent their schemes in a comprehensible graphical view, to document computer networks configurations, to depict the interactions between network's components, the used protocols and topologies, to represent physical and logical network structures, to compare visually different topologies and to depict their combinations, to represent in details the network structure with help of schemes, to study and analyze the network configurations, to communicate effectively to engineers, stakeholders and end-users, to track network working and troubleshoot, if necessary.
UML Package Diagram. Design Elements

- Sample Library System Analysis Or Design
- Data Flow Diagram Library Management System Physical And Logical
- System Package Diagram
- Data Flow Modelling
- Design elements - Bank UML package diagram | Design elements ...
- Difference Between Data Flow Diagram And Architecture Diagram
- Data flow Model Diagram
- Structured Systems Analysis and Design Method (SSADM) with ...
- Data Flow Diagram Symbols. DFD Library | Example of DFD for ...
- Data Flow Diagram For Hospital Appointment System