 Landscape & Garden
The Landscape and Gardens solution for ConceptDraw DIAGRAM is the ideal drawing tool when creating landscape plans. Any gardener wondering how to design a garden can find the most effective way with Landscape and Gardens solution.
Landscape Architecture with ConceptDraw DIAGRAM

Modern Garden Design

Pyramid Charts

How To use House Design Software

How To Create Emergency Plans and Fire Evacuation

Directions Maps

Classroom Layout

Interior Design. Registers, Drills and Diffusers — Design Elements

 Bar Graphs
The Bar Graphs solution enhances ConceptDraw DIAGRAM functionality with templates, numerous professional-looking samples, and a library of vector stencils for drawing different types of Bar Graphs, such as Simple Bar Graph, Double Bar Graph, Divided Bar Graph, Horizontal Bar Graph, Vertical Bar Graph, and Column Bar Chart. You can construct your Bar Chart both vertically and horizontally, however, the vertical form is more common.
How To Draw Building Plans

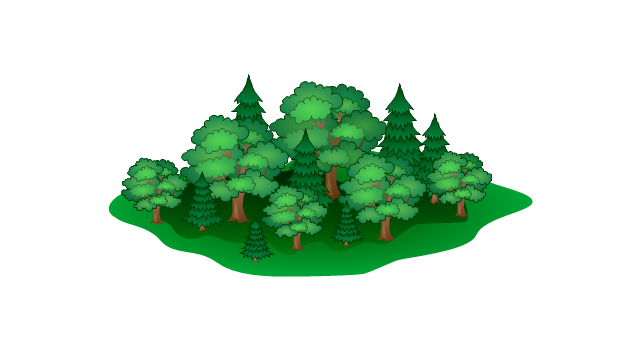
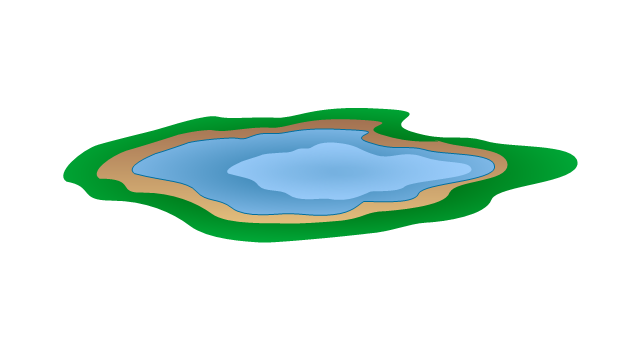
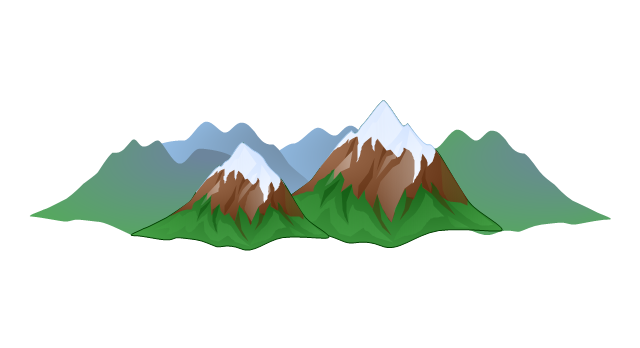
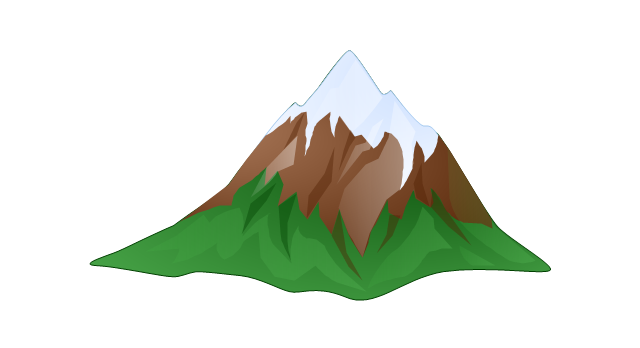
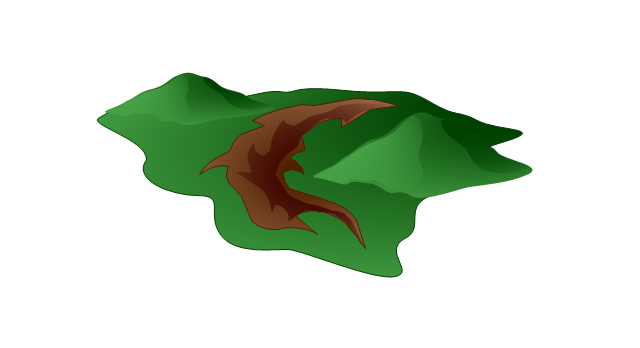
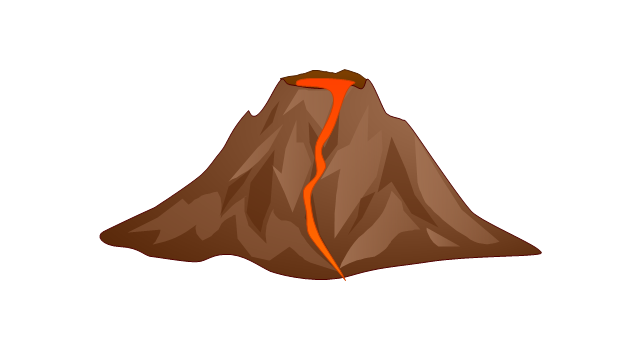
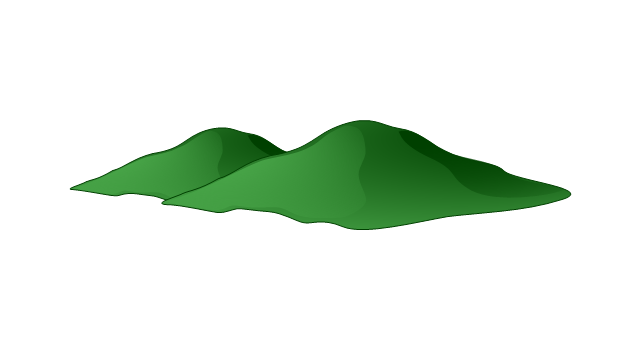
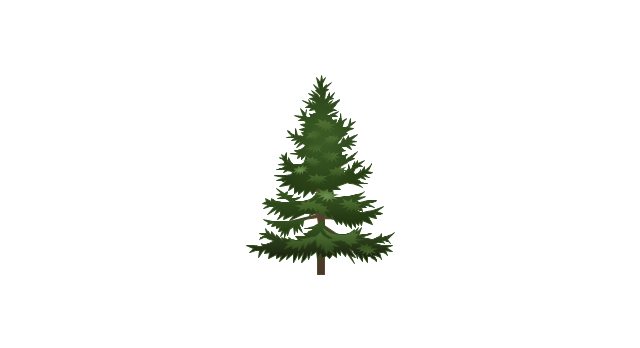
The vector stencils library "Geography" contains 14 clipart images of natural landscapes and water features for drawing illustrations.
"A natural landscape is a landscape that is unaffected by human activity. A natural landscape is intact when all living and nonliving elements are free to move and change. The nonliving elements distinguish a natural landscape from a wilderness. A wilderness includes areas within which natural processes operate without human interference, but a wilderness must contain life. As implied, a natural landscape may contain either the living or nonliving or both." [Natural landscape. Wikipedia]
The clip art example "Geography - Vector stencils library" was created using the ConceptDraw PRO diagramming and vector drawing software extended with the Nature solution from the Illustration area of ConceptDraw Solution Park.
www.conceptdraw.com/ solution-park/ illustrations-nature
Ocean

Forest
River

Lake
Waterfall

Mountains
Mountain
Ravine
Volcano
Desert

Hills
Iceberg

Conifer tree
Tree

Interior Design. Piping Plan — Design Elements

 Business Management Package
Business Management Package is a large set of graphical solutions from the ConceptDraw Solution Park. They are selected to help in solving the business, management, marketing and quality tasks in a best way. It is useful for many management specialists, marketing experts, business specialists, international business experts, IT managers, specialists in managing the business processes, financial specialists, and other business related specialists. Create documents, reports, statistical summaries, describe business processes, build business models for many fields including finance, education, logistic, landscape design, health, cooking, and many more.
How To Create Restaurant Floor Plan in Minutes


Symbol for Pool Table for Floor Plans

Create Floor Plan

How to Build a Flowchart

Interior Design. Office Layout Plan Design Element


Gym Workout Plan

- Computer Network Architecture. Computer and Network Examples ...
- Landscape Architecture with ConceptDraw DIAGRAM | Building ...
- Block Diagrams | Directional Maps | Free 3d Landscape
- How To use House Electrical Plan Software | Landscape ...
- Block Diagrams | 3d Garden Planner Software Free Download
- Landscape Architecture with ConceptDraw PRO | How To Create ...
- Landscape Architecture with ConceptDraw PRO | How To use ...
- Plant Layout Plans | 2d Design Free Download Full Version
- Landscape Architecture with ConceptDraw DIAGRAM | Flowchart ...
- Bubble diagrams in Landscape Design with ConceptDraw ...