This site uses cookies. By continuing to browse the ConceptDraw site you are agreeing to our Use of Site Cookies.

Export from ConceptDraw PRO Document to a Graphic File

Now it’s easy to share your visual documents with other people in a form most convenient for them.
ConceptDraw PRO can save your drawings and diagrams in a number of highly useful formats, including graphic files. You can save your drawing as a .PNG, .JPG, or other graphic format file.
Export to a Graphic File

KPI Dashboard

ConceptDraw PRO diagramming and vector drawing software supplied with Sales Dashboard solution from the Marketing area of ConceptDraw Solution Park provides the full set of useful tools which make it the best for producing the live KPI Dashboard of any complexity.

Dashboard Software

ConceptDraw PRo is a software that is perfect for creating dynamic dashboards for visualizing sales data. You can match your KPI to pre-designed visual indicators and start tracking your sales performance in real-time.

Business Graphics Software

ConceptDraw PRO is a business graphics software that allows you improve your business using Sales Performance Dashboard helps you analyze your data more efficiently.

Business Intelligence Dashboard Software

ConceptDraw PRO is a business intelligence dashboard software that allows you produce sales dashboard that suites your specific needs. To see how your business can improve with sales dashboards select KPI and start tracking it.
HelpDesk

How to add Several Hyperlinks to a Single Project Task

The number of hyperlinks, you can add to each project item in ConceptDraw PROJECT file is unlimited.
HelpDesk

How to Add Data-driven Infographics to a MS Word Document Using ConceptDraw PRO

Infographics ae usually used as an effective way of showing a certain portion of information . There are a wide of range of subjects that can be represented in a such way. One of the most simple usage for the infographics, in business diagrams. Sales staff can use it as an effective method of sharing the sales results with the entire team and stakeholders. ConceptDraw Data-driven Infographics solution gives all the tools one need to present a certain type of data. ConceptDraw PRO allows you to easily create data-driven infographics and then insert them into a MS Word document.

Dashboard

ConceptDraw PRO extended with Sales Dashboard solution from the Marketing area of ConceptDraw Solution Park is a perfect software for creating the live dashboard for the business data and progress visualization.
HelpDesk

How to Create Project Dashboard on PC

The visual Project Dashboard within ConceptDraw Office is the best way to deliver a clear view of project performance to all project participants.
HelpDesk

How to Connect a Live Object to a Text Data Source

Instruction on how to connect a ConceptDraw live object with data source files in TXT format to visualize the actual values of your performance metrics.
ConceptDraw Live Visual Dashboards
HelpDesk

How to Create Cisco Network Diagram Using ConceptDraw Libraries

Cisco Network chart can be a great start for detailed network documentation, as well as serve as a visual instruction for new IT staff, or as a detailed illustration for a presentation. The easiest way to design Cisco Network diagram using standard Cisco product symbols is using ConceptDraw PRO powered by Cisco Network Diagrams solution. The Cisco Network Diagrams solution uses Cisco network symbols and icons to to visually document the Cisco network topology and design of Cisco network diagrams. Using ConceptDraw libraries you can access a wide array of Cisco network icons, so you can quickly prototype a new network or document an existing one.
HelpDesk

How to Create Project Diagrams on PC

Visual diagrams gives the ability to view at a detailed level project attributes such as project scope, logical connections in the project, critical paths, key events on the timeline, milestones, tasks, calendars for work, and resource utilization.
HelpDesk

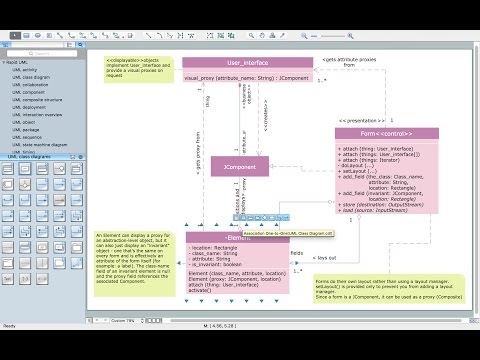
How to Create a UML Diagram Using ConceptDraw PRO

ConceptDraw PRO is a perfect tool to draw UML Diagrams.
Rapid UML Solution
Rapid UML Solution
HelpDesk

How to Create a BPMN Diagram Using ConceptDraw PRO

Business Process Modeling Notation (BPMN) is a method of illustrating business processes in the form of a diagram. The most effective method of creating or analyzing a business process is to visually interpret the steps using a business process diagram, flowchart or workflow. This is known as business process modeling, and will be performed within a company by a team who have detailed knowledge of company process, and analysts with expertise in the modeling discipline. The objective is often to increase production or lower costs — by modeling the process initially using a flowchart, inefficiencies and problems can be spotted before committing to a decision or strategy. You can create BPMN diagrams using the ConceptDraw PRO diagramming tools. ConceptDraw have designed a solution that combines BPMN v2.0 methodology and graphical notification into one powerful package. The Business Process Diagrams solution from ConceptDraw Solution Park provides a comprehensive collection of vector
HelpDesk

How to Change Measurement Units in ConceptDraw Drawing

There are different units of measurement that can be used for length dimensions. When making scaled drawing we can't keep in mind just meters, centimeters, and milimeters ; we also need remember about yards, feets and inches . This is because the United States applies its own system of measurement units, while the rest of the world employs metric measurement units. ConceptDraw PRO enables choosing the most suitable units of measurement with just one click.