This site uses cookies. By continuing to browse the ConceptDraw site you are agreeing to our Use of Site Cookies.

Gantt chart examples

All Gantt charts were made using ConceptDraw PROJECT. ConceptDraw PROJECT works both on Windows and Mac OS X. It allows to schedule a voluntary number of projects in a single Workspace document and lets easily share tasks and resources among them. ConceptDraw PROJECT shares files among Windows and Mac OS X.

Create Response Charts

Visual navigation through the stages of a response process helps you locate specific actions to be taken via Action Mind Maps. Use ConceptDraw PRO and ConceptDraw MINDMAP for organize the process of response for interactions occurring in social media.
HelpDesk

How to Use ConceptDraw Sales Dashboard Solution

The interactive visual dashboard is a valuable tool for any sales team. Sales dashboard allows you to view and monitor sales indicators that are important for manager and sales staff . It helps to use the timely and reliable information to improve the quality of sales performance and increase sales revenues. ConceptDraw Sales Dashboard solution is a tool for both: sales manager and sales team. It provides the visualization of key performance indicators that are critical to the entire sales organization. The custom sales dashboard displays the real-time information on sales performance KPIs with the help of intuitive and easy-to-understand diagrams and charts. Sales Dashboard helps the entire team see where they are, and what needs to be done. With ConceptDraw PRO you can easily create a visual Sales Dashboard using Live Objects Technology.
ConceptDraw Live Visual Dashboards

Activity Network (PERT) Chart

Activity Network and Project Evaluation and Review Technique, or PERT, charts are a way of documenting and analyzing the tasks in a project.
This diagram is constructed as part of the process in creating a schedule of corrective actions. The Activity Network Chart (PERT) shows the logical connections and consequence of tasks to be performed. It displays the time period for problem solving and the implementation of all activities through the critical path.
HelpDesk

How to Use Mind Maps During a Lecture

How To Use Mind Map During the Lecture. For students, parents, or academic institutions who are looking for ways to make studying more fun and interesting.

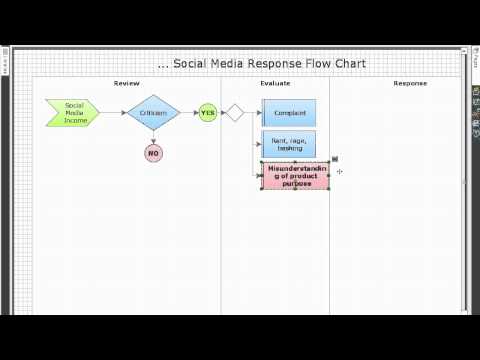
How to Connect Social Media DFD Flowchart with Action Maps

The Social Media Response solution creates interactive social media flow charts and action mind maps. The solution includes a video tutorial and a number of samples helping social media teams refine and organize their response process.

Project —Task Trees and Dependencies

Users new to ConceptDraw PROJECT will find the Basic lessons an essential platform for familiarizing themselves with the program′s functions. This video lesson will teach you how to set up task trees and dependencies.

Activity Network Diagram Method

Activity Network Diagram - This sample was created in ConceptDraw PRO diagramming and vector drawing software using the Seven Management and Planning Tools solution from the Management area of ConceptDraw Solution Park.
This sample shows the PERT (Program Evaluation Review Technique) chart of the request on proposal. A request for proposal (RFP) is a request of the company or the organization to potential suppliers to submit the business proposals for service or goods that it is interested to purchase. The RFP is represented on the initial procurement stage and allows to define the risks and benefits.

Booch OOD Diagram

The vector stencils library Booch OOD from the solution Software Engineering contains specific symbols of the Booch method such as class symbols, association symbols, aggregation symbols for ConceptDraw PRO diagramming and vector drawing software. The Software Engineering solution is contained in the Software Development area of ConceptDraw Solution Park.

Activity on Node Network Diagramming Tool

Activity on Node Network Diagramming Tool - Activity Network and Project Evaluation and Review Technique, or PERT, charts are a way of documenting and analyzing the tasks in a project.
This sample shows the Activity on node network diagramming method. It was created in ConceptDraw PRO diagramming and vector drawing software using the Seven Management and Planning Tools solution from the Management area of ConceptDraw Solution Park.
HelpDesk

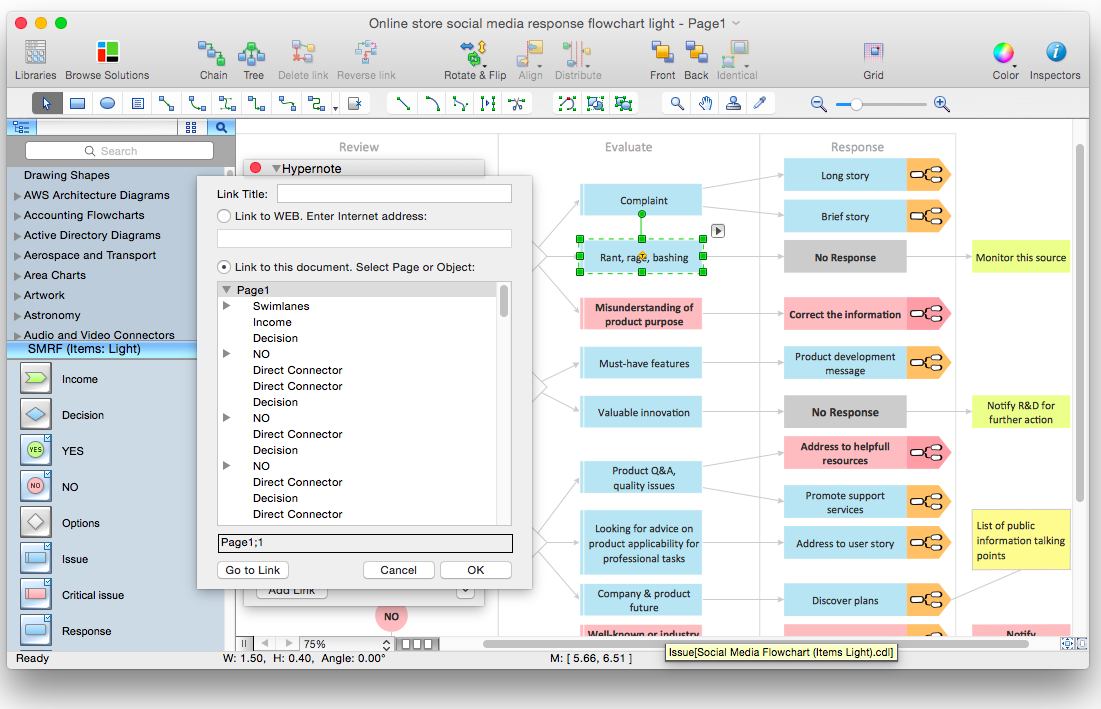
How to Organize a Social Media Activity Using Social Media Response Solution

Tips on how to use flowcharting and mindmapping for social media activity organizing
Create a Social Media Flowchart

UML Class Diagram Example - Buildings and Rooms

This sample was created in ConceptDraw PRO diagramming and vector drawing software using the UML Class Diagram library of the Rapid UML Solution from the Software Development area of ConceptDraw Solution Park.
This sample shows the structure of the building and can be used by building companies, real estate agencies, at the buying / selling of the realty.

How To Use Collaboration Software

Collaboration Software helps to transform shared MINDMAP documents to build an effective team collaboration.

UML Activity Diagram. Design Elements

UML Activity Diagram illustrate the business and operational step-by-step workflow of components in a system and shows the overall flow of control.

The Best Choice for Creating Diagram

Download ConceptDraw diagram software for easy drawing.