HelpDesk
How To Create a PERT Chart
Project Evaluation and Review Technique (PERT) is a method of project tasks evaluation and analysis. PERT - is a method of analyzing the tasks required to complete the project. It includes analysis of the time required to complete each task, as well as the determination of the time required to carry out the whole project. PERT was developed to facilitate the planning of huge and complex projects. PERT is used for very large, complex, and non-standard projects. Technology implies the presence of uncertainty, making it possible to develop a schedule of the project without a precise information on details and time required for all of its components. The most popular part of PERT is a method of the critical path, based on the construction of the network schedule (PERT network diagram). ConceptDraw Office delivers you the best way to create PERT chart for your project using compatibility between ConceptDraw PROJECT and ConceptDraw PRO.HelpDesk
How to Draw a Gantt Chart Using ConceptDraw PRO
A Gantt chart is intended to provide a visualization of a project schedule. It is developed to help planning, coordinating, and tracking on project tasks implementation. One of the most critical resources for a project implementation is a time resources. Gantt chart - is one of the most convenient and popular way of graphical representation of a project tasks progress in conjunction with the corresponding time consumption. Gantt chart's function is to show project tasks completion in a progress, and to make a project manager sure that project tasks were completed on time. ConceptDraw Office is a clear and easy-to-use tool for project management. It is a very handy visual tool that helps make a project processing clear.HelpDesk
How to Connect Text Data to a Time Series Chart on Your Live Dashboard
Time Series Dashboard means an integration of some type of diagrams: Line Charts, Bar Charts, Column Charts, and Dot Plots on a single space. The ConceptDraw Time Series Dashboard solution can be used to create the interactive Time Series dashboard. The libraries of Time Series Charts solution contain the Live Objects, that can change their appearance depending on the external data. Each chart from the Time Series dashboard displays particular source data. You can include Time Series Charts in your business or technical dashboards to show and compare the items changing over time.
HelpDesk
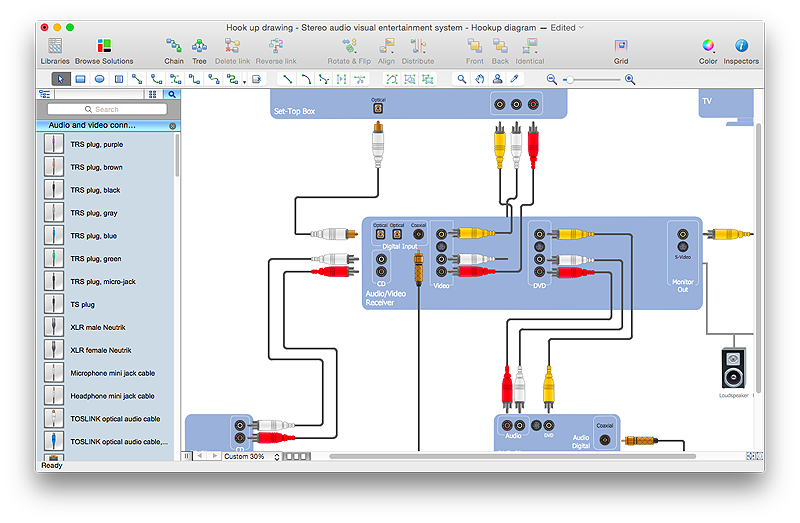
How to Create a Hook Up Diagram
Hook-up diagram of audio-video system is a detailed drawing showing the audio video connections in a correct manner so that system operates properly. Using the hook up diagram you can understand how the elements of your audio-video system should be installed. ConceptDraw PRO allows you to draw the Hook Up diagram of Audio-Video system easily using the set of special libraries provided by Audio and Video Connectors solution.Gantt charts for planning and scheduling projects
ConceptDraw PROJECT is an excellent simple project scheduling software. It maintain classic project gantt charts and the line of professional reports on resources usage. It include handy critical path scheduling software tools and diagraming tools which helps prepare the presentation of project status. It include project tracking dashboard to keep project metrics upto date, also it have handy feature to export project management dashboard in excel file.- How to Report Task's Execution with Gantt Chart | How to Create ...
- Best Flowchart Software | Create Flow Chart on Mac | Process ...
- How to Report Task's Execution with Gantt Chart | Gant Chart in ...
- Flow Chart To Generate Cab Invoice
- Gant Chart in Project Management | How to Create Presentation of ...
- How to Draw a Gantt Chart Using ConceptDraw PRO | Gant Chart in ...
- Gantt chart examples | Gant Chart in Project Management | How to ...
- How to Create Presentation of Your Project Gantt Chart | How to ...
- How to Create a Social Media DFD Flowchart | Create Flow Chart on ...
- How to Report Task's Execution with Gantt Chart | Gant Chart in ...
- How to Draw a Gantt Chart Using ConceptDraw PRO | How to ...
- How to Report Task's Execution with Gantt Chart | How to Create a ...
- How To Do A Mind Map In PowerPoint | Organizational Chart ...
- Gant Chart in Project Management | Gantt chart examples | How to ...
- Construction Project Chart Examples | How to Create Presentation ...
- How to Draw a Bubble Chart | How To Create a Bubble Chart | How ...
- How to Draw an Organization Chart | ConceptDraw PRO ...
- Gant Chart in Project Management | How to Create Presentation of ...
- How to Draw a Gantt Chart Using ConceptDraw PRO | How to Draw ...


