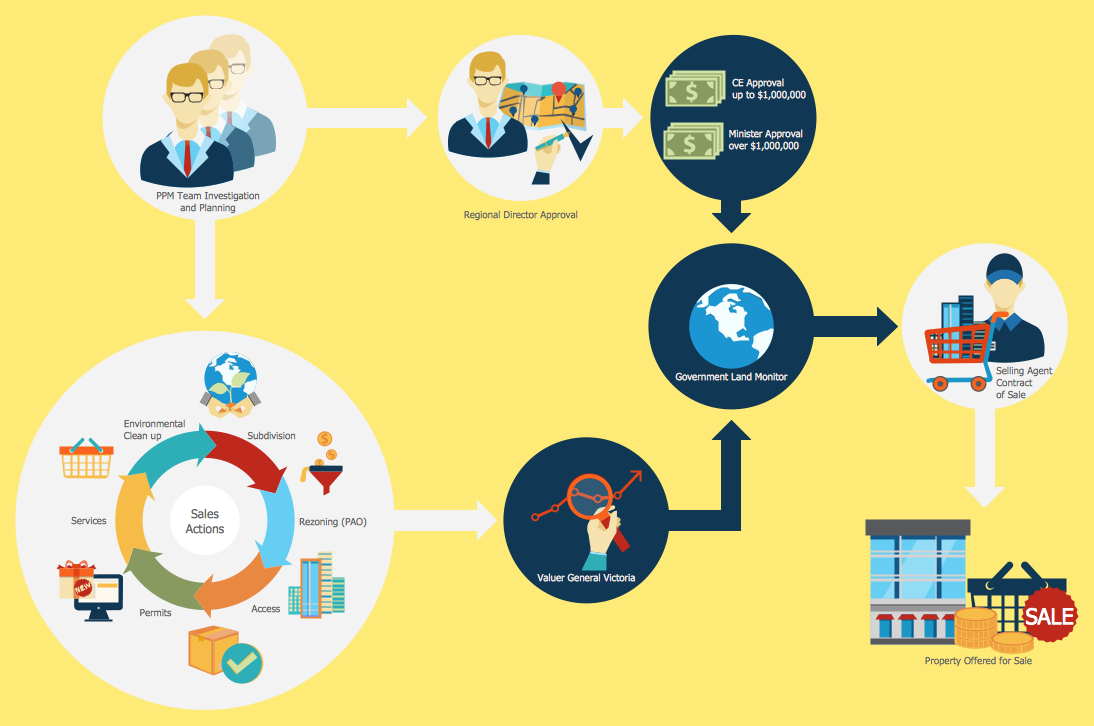
Sales Process Flowchart. Flowchart Examples
Sales Process Flowchart is an invaluable tool for business. It gives you opportunity to visualise and better understand the sales process, reveal and also visually highlight issues or bottlenecks, and predict the number of sales. The Flowchart is ideal method to represent in details all steps of the process, tasks and decisions needed to obtain maximum effectiveness and success. The steps are graphically represented by boxes linked with arrows indicating direction of the workflow, decision is shown by diamond. The sales process is closely linked to the company's success and usually includes the following main steps: Product knowledge, Prospecting, Planning the sale (Pre-approach), Approach, Need assessment, Presentation, Meeting objections, Gaining commitment, Follow-up. Create fast and easy your own Flowcharts of sales business processes using the ConceptDraw DIAGRAM ector graphic software extended with Cross-Functional Flowcharts solution from Business Processes area and also Sales Flowcharts solution from Marketing area of ConceptDraw Solution Park.
Sales Flowcharts
The Sales Flowcharts solution lets you create and display sales process maps, sales process workflows, sales steps, the sales process, and anything else involving sales process management.
Basic Flowchart Symbols and Meaning
Flowcharts are the best for visually representation the business processes and the flow of a custom-order process through various departments within an organization. ConceptDraw DIAGRAM diagramming and vector drawing software extended with Flowcharts solution offers the full set of predesigned basic flowchart symbols which are gathered at two libraries: Flowchart and Flowcharts Rapid Draw. Among them are: process, terminator, decision, data, document, display, manual loop, and many other specific symbols. The meaning for each symbol offered by ConceptDraw gives the presentation about their proposed use in professional Flowcharts for business and technical processes, software algorithms, well-developed structures of web sites, Workflow diagrams, Process flow diagram and correlation in developing on-line instructional projects or business process system. Use of ready flow chart symbols in diagrams is incredibly useful - you need simply drag desired from the libraries to your document and arrange them in required order. There are a few serious alternatives to Visio for Mac, one of them is ConceptDraw DIAGRAM. It is one of the main contender with the most similar features and capabilities.
Data Flow Diagram
Data Flow Diagram (DFD) is the part of the Structured Systems Analysis and Design Methodology (SSADM), which is intended for information systems projection and analysis. Data Flow Diagrams allow graphically represent the data flows in information system and analyze the data processing during the structural projection. This type of diagrams lets visually show a work of information system and results of this work, it is often used in connection with human processes and can be displayed as Workflow diagram. Data Flow Diagram visualizes processes and functions, external entities, data depositories, and data flows connecting these elements and indicating direction and data character. Each of these elements used for DFD has its own graphical notation. There are two notations to draw DFDs - Yourdon & Coad and Gane & Sarson. ConceptDraw DIAGRAM extended with Data Flow Diagrams (DFD) solution from Software Developmant area is ideal for designing professional looking DFDs, which can be then easily exported in various formats.Sales Steps
Helps to create professionally looking and detailed Sales Flowcharts with all sales steps visually represented on them. Use the Sales Flowcharts Solution for ConceptDraw DIAGRAM software to create your own Sales Flowcharts of any complexity quickly, easily and effectively to use them successfully in your work activity. ConceptDraw DIAGRAM diagramming and vector drawing software supplied with unique Sales Flowcharts solution from the Marketing area of ConceptDraw Solution Park allows fast and easy visualize all sales steps of the sales process on a sales process Map or sales process flowchart, and then realize them easily.Purchasing Flowchart - Purchase Order. Flowchart Examples
Create your own flow charts of purchasing business processes using the ConceptDraw DIAGRAM diagramming and vector drawing software extended with the Accounting Flowcharts solution from the Finance and Accounting area of ConceptDraw Solution Park. The flow chart example shows the steps of purchasing business process.HR Flowchart Symbols
Human resources are the people who make up the employee workforce of an organization or company. Human resource management has four basic functions: staffing, motivation, training and development, and maintenance. It is convenient to use the flowcharts to represent various HR processes and workflows. ConceptDraw DIAGRAM diagramming and vector drawing software extended with HR Flowcharts solution from the Management area of ConceptDraw Solution Park supplies you with comprehensive selection of predesigned vector HR flowchart symbols and standardized flowchart notation symbols, which allow you to design effectively the eye-catching infographics and diagrams relating to any human resource management process that will be relevant and understood by all business associates. The ConceptDraw DIAGRAM software offers also the set of predesigned flowchart and workflow templates and samples making your drawing process as easy as possible. Use the HR Flowcharts solution to create professional-looking HR Flowcharts and HRM Business Process Diagrams in a matter of moments.Accounting Flowchart Symbols
Accounting is a well known and popular tool used for gaining full quantitative information about the finances. The accounting process includes extensive set of activities that begins with transactions and ends with closing of books. It contains all financial information for a given organization, the data about incomes, expenditures, purchases, sales, return, payroll, and many other numerical information. The excellent possibility to create great-looking Accounting Flowcharts is offered by professional ConceptDraw DIAGRAM diagramming and vector drawing software. It includes the Accounting Flowcharts solution containing wide variety of predesigned accounting flowchart symbols. All symbols are easy recognizable, commonly used, vector and professionally designed, so are capable effectively save your time and efforts when representing all stages of accounting work process, the flow of data in an organization, accounting procedures and processes, documents, tasks, responsible people, users, components and authorizations.
Cross-Functional Flowcharts
Cross-functional flowcharts are powerful and useful tool for visualizing and analyzing complex business processes which requires involvement of multiple people, teams or even departments. They let clearly represent a sequence of the process steps, the order of operations, relationships between processes and responsible functional units (such as departments or positions).
Flowcharts
The Flowcharts solution for ConceptDraw DIAGRAM is a comprehensive set of examples and samples in several varied color themes for professionals that need to represent graphically a process. Solution value is added by the basic flow chart template and shapes' libraries of flowchart notation. ConceptDraw DIAGRAM flow chart creator lets one depict the processes of any complexity and length, as well as design the Flowchart either vertically or horizontally.
- Arrow Inside Sales Process Flowchart
- Sales Process Flowchart . Flowchart Examples | Sales Process ...
- Sales Flowcharts | Business Process Marketing And Sales Flowchart
- Sales Process Flowchart Symbols | SWOT Sample in Computers ...
- Business Process Flowchart Symbols | Flowchart Software ...
- Design elements - Sales department | Workflow diagrams - Vector ...
- Sales Process Flowcharts
- Sales Process Flowchart Symbols | Sales Process Flowchart ...
- Sales Process Flowchart . Flowchart Examples