The vector stencils library "HR symbols" contains 45 HR pictograms.
Use this icon set with HR symbols to draw your HR flowcharts, workflow diagrams, process charts and infographics with the ConceptDraw PRO diagramming and vector drawing software.
The HR pictograms library "HR symbols" is included in the HR Flowcharts solution from the Management area of ConceptDraw Solution Park.
Absence management

Absenteeism

Achievement

Attract

Authority and accountability

Business goals

Business success

Capital formation

Career

Career ladder

Communication

Compensation management

Conflict management

Conformance

Dress code

Education

Global HR

Headhunting

Hierarchical organization

Human capital

Human resource management

Incentive compensation management

Increase productivity

Job performance

Job satisfaction

Labor Unions

Leadership

Motivation and incentives

Organizational culture

Partnership

Performance management

Problem solving

Retention

Skill

Smart ideas

Staff turnover

Succession management

Talent acquisition

Time efficiency

Time management

Timekeeping

Winner

Workforce planning

Workplace culture

Workplace health and safety

The vector stencils library "HR symbols" contains 45 HR pictograms.
Use this icon set with HR symbols to draw your HR flowcharts, workflow diagrams, process charts and infographics with the ConceptDraw PRO diagramming and vector drawing software.
The HR pictograms library "HR symbols" is included in the HR Flowcharts solution from the Management area of ConceptDraw Solution Park.
Use this icon set with HR symbols to draw your HR flowcharts, workflow diagrams, process charts and infographics with the ConceptDraw PRO diagramming and vector drawing software.
The HR pictograms library "HR symbols" is included in the HR Flowcharts solution from the Management area of ConceptDraw Solution Park.
Absence management
Absenteeism
Achievement
Attract
Authority and accountability
Business goals
Business success
Capital formation
Career
Career ladder
Communication
Compensation management
Conflict management
Conformance
Dress code
Education
Global HR
Headhunting
Hierarchical organization
Human capital
Human resource management
Incentive compensation management
Increase productivity
Job performance
Job satisfaction
Labor Unions
Leadership
Motivation and incentives
Organizational culture
Partnership
Performance management
Problem solving
Retention
Skill
Smart ideas
Staff turnover
Succession management
Talent acquisition
Time efficiency
Time management
Timekeeping
Winner
Workforce planning
Workplace culture
Workplace health and safety
This cause and effect diagram sample was redesigned from the Wikimedia Commons file: Ursache Wirkung Diagramm Beispiel.png. [commons.wikimedia.org/ wiki/ File:Ursache_ Wirkung_ Diagramm_ Beispiel.png]
This file is licensed under the Creative Commons Attribution-Share Alike 3.0 Unported license. [creativecommons.org/ licenses/ by-sa/ 3.0/ deed.en]
"Productivity is the ratio of output to inputs in production; it is an average measure of the efficiency of production. Efficiency of production means production’s capability to create incomes which is measured by the formula real output value minus real input value.
Productivity is a crucial factor in production performance of firms and nations. Increasing national productivity can raise living standards because more real income improves people's ability to purchase goods and services, enjoy leisure, improve housing and education and contribute to social and environmental programs. Productivity growth also helps businesses to be more profitable." [Productivity. Wikipedia]
The fishbone diagram example "Increase in productivity" was created using the ConceptDraw PRO diagramming and vector drawing software extended with the Fishbone Diagrams solution from the Management area of ConceptDraw Solution Park.
Ishikawa diagram

Cause and Effect Diagram

The vector stencils library "HR symbols" contains 45 HR pictograms.
Use this icon set with HR symbols to draw your HR flowcharts, workflow diagrams, process charts and infographics with the ConceptDraw PRO diagramming and vector drawing software.
The HR pictograms library "HR symbols" is included in the HR Flowcharts solution from the Management area of ConceptDraw Solution Park.
Use this icon set with HR symbols to draw your HR flowcharts, workflow diagrams, process charts and infographics with the ConceptDraw PRO diagramming and vector drawing software.
The HR pictograms library "HR symbols" is included in the HR Flowcharts solution from the Management area of ConceptDraw Solution Park.
Absence management
Absenteeism
Achievement
Attract
Authority and accountability
Business goals
Business success
Capital formation
Career
Career ladder
Communication
Compensation management
Conflict management
Conformance
Dress code
Education
Global HR
Headhunting
Hierarchical organization
Human capital
Human resource management
Incentive compensation management
Increase productivity
Job performance
Job satisfaction
Labor Unions
Leadership
Motivation and incentives
Organizational culture
Partnership
Performance management
Problem solving
Retention
Skill
Smart ideas
Staff turnover
Succession management
Talent acquisition
Time efficiency
Time management
Timekeeping
Winner
Workforce planning
Workplace culture
Workplace health and safety
Export from ConceptDraw DIAGRAM Document to a Graphic File


Cause and Effect Fishbone Diagram

Create Fishbone Diagrams

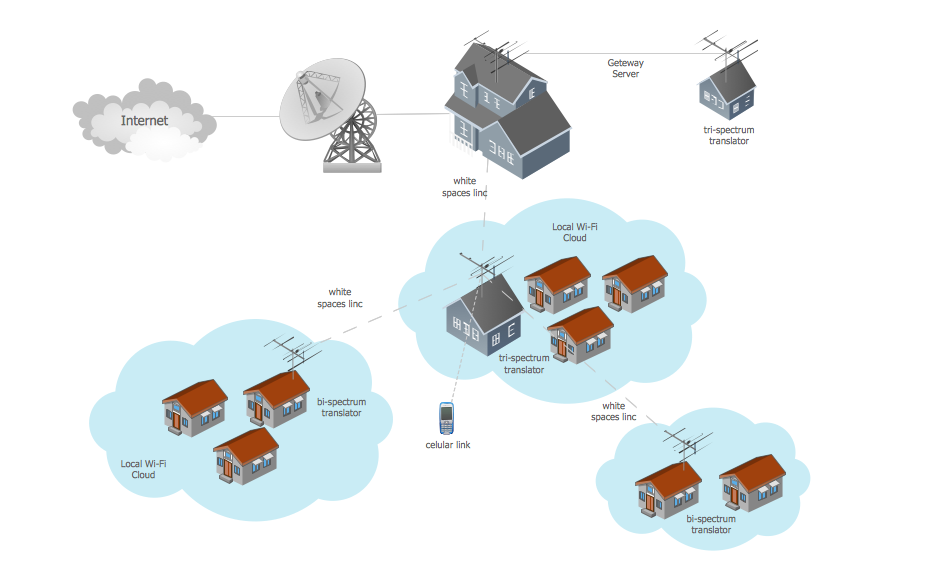
Personal area (PAN) networks. Computer and Network Examples
 networks")

Business Graphics Software
Cisco Security. Cisco icons, shapes, stencils and symbols

Wide area network (WAN) topology. Computer and Network Examples
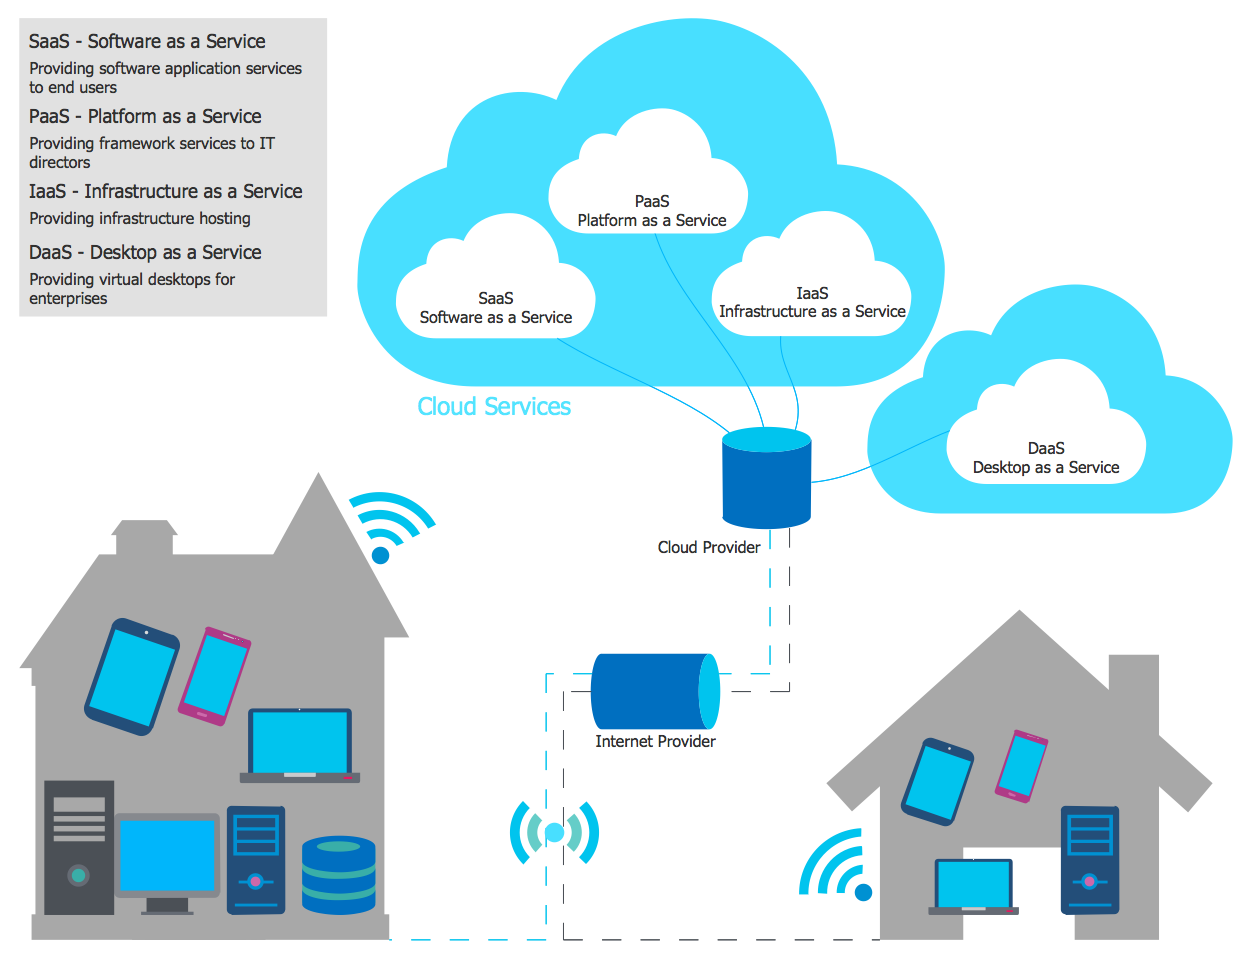
How Cloud Computing Works
Flyer Templates
- Cause and effect diagram - Increase in productivity | HR symbols ...
- Business Productivity - Marketing | HR symbols - Vector stencils ...
- Productivity Vectors Png
- Increase productivity
- Cause and effect diagram - Increase in productivity | Nuclear physics ...
- Employee Productivity Vector Png
- Total Quality Management Value | Cause and effect diagram ...
- Cause and effect diagram - Increase in productivity | Fishbone ...
- Cause and effect diagram - Increase in productivity | Business ...
- Fishbone diagram - Bad coffee | Cause and effect diagram ...
- Cause and effect diagram - Increase in productivity | Total Quality ...
- Business Process Modeling Notation | HR symbols - Vector stencils ...
- HR symbols - Vector stencils library | HR symbols - Vector stencils ...
- Fishbone Diagrams | Cause and effect diagram - Increase in ...
- Human Resource Management | HR symbols - Vector stencils ...
- Cause and effect diagram - Increase in productivity | Home area ...
- HR symbols - Vector stencils library | HR Flowchart Symbols ...
- HR symbols - Vector stencils library | HR Flowchart Symbols | HR ...
- Cause and effect diagram - Increase in productivity | Process ...
- HR symbols - Vector stencils library | Management pictograms ...