HR infographics "Electronic human resources (E-HR)" was redesigned from the Wikimedia Commons file: Ehr diagram.jpg. [commons.wikimedia.org/ wiki/ File:Ehr_ diagram.jpg]
This file is licensed under the Creative Commons Attribution-Share Alike 3.0 Unported license. [creativecommons.org/ licenses/ by-sa/ 3.0/ ]
"E-HR is a function of HR that is concerned with the use, management, and regulation of electronic information and processes within an organization.
E-HR is different from E-HRM (Electronic Human Resource Management) and HRIS (Human Resource Information System) which are uses of technology. More specifically, E-HRM is a system that allows management and employees access to human resource related information and services through an organization's intranet or web portal. HRIS refers to enterprise resource planning software that streamlines human resource functions such as payroll.
In contrast, E-HR is a function of human resources that requires cross-functional knowledge and collaboration between multiple departments, most notably human resources and information technology." [Electronic human resources. Wikipedia]
The HR infographics example "Electronic human resources (E-HR)" was created using the ConceptDraw PRO diagramming and vector drawing software extended with the HR Flowcharts solution from the Management area of ConceptDraw Solution Park.
HR infographics
.png--diagram-flowchart-example.png)
Used Solutions
Basic Flowchart Symbols and Meaning


Types of Flowchart - Overview


Garrett IA Diagrams with ConceptDraw PRO

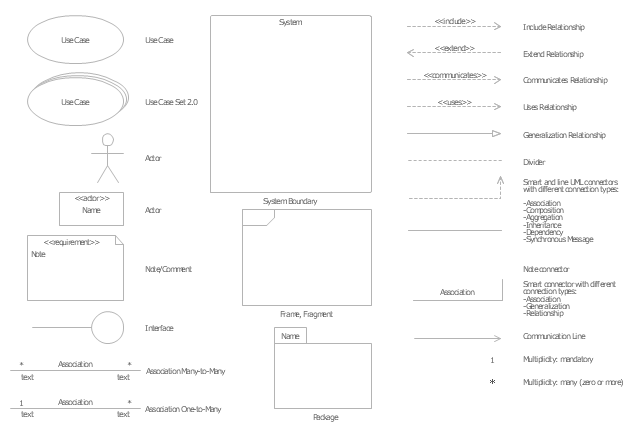
The vector stencils library "UML use case diagrams" contains 25 symbols for the ConceptDraw PRO diagramming and vector drawing software.
"Use case diagrams are usually referred to as behavior diagrams used to describe a set of actions (use cases) that some system or systems (subject) should or can perform in collaboration with one or more external users of the system (actors). Each use case should provide some observable and valuable result to the actors or other stakeholders of the system. ...
Use case diagrams are in fact twofold - they are both behavior diagrams, because they describe behavior of the system, and they are also structure diagrams - as a special case of class diagrams where classifiers are restricted to be either actors or use cases related to each other with associations. ...
Use case is usually shown as an ellipse containing the name of the use case. ...
Name of the use case could also be placed below the ellipse. ...
If a subject (or system boundary) is displayed, the use case ellipse is visually located inside the system boundary rectangle. Note, that this does not necessarily mean that the subject classifier owns the contained use cases, but merely that the use case applies to that classifier. ...
A list of use case properties - operations and attributes - could be shown in a compartment within the use case oval below the use case name. ...
Use case with extension points may be listed in a compartment of the use case with the heading extension points. ...
A use case can also be shown using the standard rectangle notation for classifiers with an ellipse icon in the upper right-hand corner of the rectangle and with optional separate list compartments for its features. ...
Subject (sometimes called a system boundary) is presented by a rectangle with subject's name, associated keywords and stereotypes in the upper left corner. Use cases applicable to the subject are located inside the rectangle and actors - outside of the system boundary. ...
Standard UML notation for actor is "stick man" icon with the name of the actor above or below of the icon. Actor names should follow the capitalization and punctuation guidelines for classes. The names of abstract actors should be shown in italics. ...
Custom icons that convey the kind of actor may also be used to denote an actor, such as using a separate icon(s) for non-human actors. ...
An actor may also be shown as a class rectangle with the standard keyword «actor», having usual notation for class compartments ...
An actor can only have binary associations to use cases, components, and classes. ...
An association between an actor and a use case indicates that the actor and the use case somehow interact or communicate with each other.
Only binary associations are allowed between actors and use cases.
An actor could be associated to one or several use cases. ...
A use case may have one or several associated actors." [uml-diagrams.org/ use-case-diagrams.html]
The example "Design elements - UML use case diagrams" is included in the Rapid UML solution from the Software Development area of ConceptDraw Solution Park.
UML use case diagram symbols
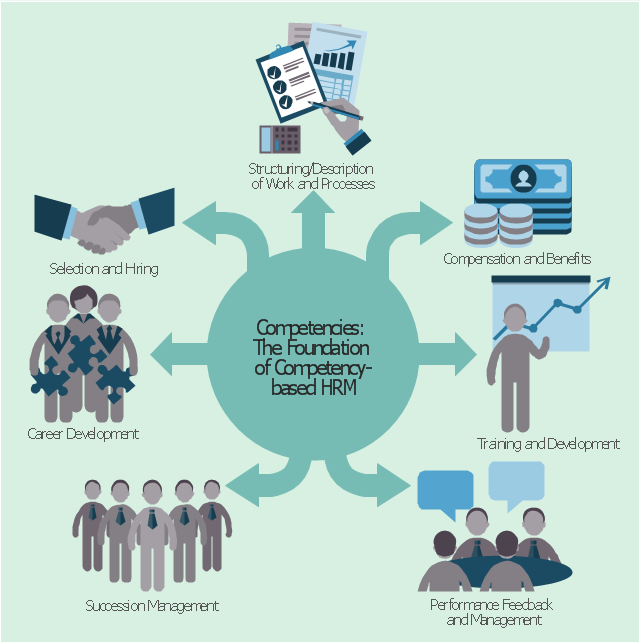
HR infographics "Components of competency based management" was redesigned from the Wikipedia file: Competency-circle.jpg. [en.wikipedia.org/ wiki/ File:Competency-circle.jpg]
This file is licensed under the Creative Commons Attribution-ShareAlike 3.0 License. [creativecommons.org/ licenses/ by-sa/ 3.0/ ]
"Competency-based human resources planning serves as a link between human resources management and the overall strategic plan of an organization. Competencies are defined as observable abilities, skills, knowledge, motivations or traits defined in terms of the behaviours needed for successful job performance.
Competency-based management supports the integration of human resources planning with business planning by allowing organizations to assess the current human resource capacity based on their competencies against the capacity needed to achieve the vision, mission and business goals of the organization. Targeted human resource strategies, plans and programs to address gaps (e.g., hiring and staffing; learning; career development; succession management; etc.) are then designed, developed and implemented to close the gaps." [Competency-based management. Wikipedia]
The HR infographics example "Components of competency based management" was created using the ConceptDraw PRO diagramming and vector drawing software extended with the HR Flowcharts solution from the Management area of ConceptDraw Solution Park.
HR Infographics
Interior Design

HR Management Software

Process Flowchart


Gane Sarson Diagram

 HR Flowcharts
Human resource management diagrams show recruitment models, the hiring process and human resource development of human resources.
KPI Dashboard

HelpDesk
How to Determine what Information to be Displayed in the Project Resource List


Using Fishbone Diagrams for Problem Solving

- Human Resource Management | Project — Assigning Resources ...
- Human Resource Development | How to Plan and Allocate ...
- How to Plan and Allocate Resources in Your Project with ...
- Human Resource Development | Gant Chart in Project Management ...
- Types of Flowchart - Overview | HR Flowchart Symbols | HR ...
- Process Flowchart | Diagram And Pie Charts On Fundamental Rights
- Project —Task Trees and Dependencies | Project management task ...
- Human Resources | Electronic human resources (E-HR) | Human ...
- How to Plan and Allocate Resources in Your Project on Mac | How ...
- Types of Flowchart - Overview | Basic Flowchart Symbols and ...
- How to Create a HR Process Flowchart Using ConceptDraw PRO ...
- Flow chart Example. Warehouse Flowchart | Hiring process workflow ...
- Types of Flowchart - Overview | Human Resource Management ...
- Human Resources | Human Resource Development | Human ...
- Gantt chart examples | How to Plan and Allocate Resources in Your ...
- Human Resource Development | Human Resource Management ...
- Project Exchange | How to Exchange Files with MS Project Users ...
- Basic Flowchart Symbols and Meaning | Human Resource ...
- How to Draw a Gantt Chart Using ConceptDraw PRO | How to ...
- Flowchart Components | Flow chart Example. Warehouse Flowchart ...