How to Connect Social Media DFD Flowchart with Action Maps

Flowchart of Products. Flowchart Examples

How to Prepare Learning Presentations for Training

How to Use the ″Online Store PR Campaign″ Sample

What Is an Action Mind Map

How to Present a Social Media Response Plan DFD to Your Team

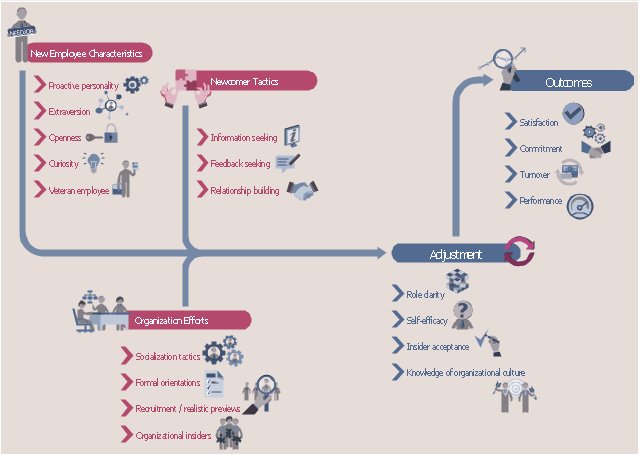
HR infographics "Onboarding model" was redesigned from the Wikimedia Commons file: Organizationalsocializationmodel.jpg. [commons.wikimedia.org/ wiki/ File:Organizationalsocializationmodel.jpg]
This file is licensed under the Creative Commons Attribution-Share Alike 3.0 Unported license. [creativecommons.org/ licenses/ by-sa/ 3.0/ ]
"Onboarding, also known as organizational socialization, refers to the mechanism through which new employees acquire the necessary knowledge, skills, and behaviors to become effective organizational members and insiders. Tactics used in this process include formal meetings, lectures, videos, printed materials, or computer-based orientations to introduce newcomers to their new jobs and organizations. Research has demonstrated that these socialization techniques lead to positive outcomes for new employees such as higher job satisfaction, better job performance, greater organizational commitment, and reduction in occupational stress and intent to quit. These outcomes are particularly important to an organization looking to retain a competitive advantage in an increasingly mobile and globalized workforce." [Onboarding. Wikipedia]
The HR infographics example "Onboarding model" was created using the ConceptDraw PRO diagramming and vector drawing software extended with the HR Flowcharts solution from the Management area of ConceptDraw Solution Park.
HR Infographics
Recruitment

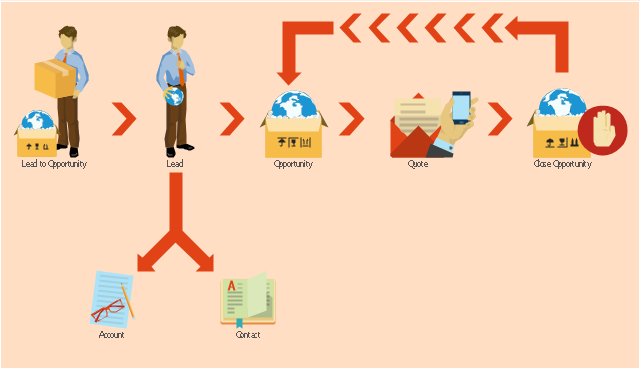
This example shows the Microsoft Dynamics CRM workflow from lead to opportunity. It was redesigned from the Wikimedia Commons file: Lead to Opportunity sales flow.svg. [commons.wikimedia.org/ wiki/ File:Lead_ to_ Opportunity_ sales_ flow.svg]
"Does your lead have what you're looking for - and vice versa? Once you've identified the timeframe, budget, purchase process, and decision makers for the sale, it's time to qualify your lead. Qualifying a lead in Microsoft Dynamics CRM converts it to an opportunity.
Ideally, your leads or prospects should have a need that you can provide a solution for, and have the budget and influence necessary for making the purchasing decision. In addition, you should be able to provide their solution within the timeframe they need it." [microsoft.com/ en-us/ dynamics/ crm-customer-center/ qualify-a-lead-and-convert-it-to-an-opportunity.aspx]
The example "Workflow - Lead to Opportunity" was created using the ConceptDraw PRO diagramming and vector drawing software extended with the Sales Flowcharts solution from the Marketing area of ConceptDraw Solution Park.
Sales workflow diagram
How To Create Onion Diagram

Stakeholder Onion Diagram Template

Organizing and Selecting Social Media Response Action

The vector stencils library "Sales KPIs and Metrics" contains 15 chart templates and graphic indicators of sales key performance indicators (KPIs) and metrics for drawing sales dashboards: line charts "Cost per order" and "Clicks from Sales Follow-Up Emails", column charts "Social Media Usage" and "Usage Rate of Marketing Collateral", horizontal bar charts "Rate of Follow Up Contact", "Cost per customer" and "Lead Response Time", pie charts "Product mix", "Product Performance" and "Rate of Contact", gauge (speedometer) indicators "Sales Growth" and "Actual vs Plan", bullet indicator "Sales Target", diamond alarm indicators "Average Purchase Value", "Quote to Close Ratio", "Opportunity-to-Win Ratio" and "Sales Ratio".
The dashboard charts and indicators example "Design elements - Sales KPIs and metrics" for the ConceptDraw PRO diagramming and vector drawing software is included in the Sales Dashboard solution from the Marketing area of ConceptDraw Solution Park.
www.conceptdraw.com/ solution-park/ marketing-sales-dashboard
Sales dashboard charts and graphic indicators

- HR Flowcharts | Onboarding model | Flow Chart Creator ...
- Flow chart Example. Warehouse Flowchart | Pyramid Chart ...
- Flow Charts On Socialization
- Employee Chart
- New Employee Onboarding Process Flow Chart
- Flowchart Of Employee And Admin Login Form
- Invoice payment process - Flowchart | Sales Flowcharts | Lead to ...
- JSD - Jackson system development | How to Create a Social Media ...
- Workflow - Lead to Opportunity | Sales Process Management ...
- Flowchart Marketing Process. Flowchart Examples | Marketing Flow ...
- National Preparedness Cycle - Arrow ring chart | Program to Make ...
- Use the Best FlowChart Tool for the Job | Affinity diagram - Checkout ...
- Invoice payment process - Flowchart | Invoice lifecycle | Business ...
- Flowchart Of Employees In Software Company
- Basic Flowchart Symbols and Meaning | Business feedback loop ...
- Sales Process Flowchart . Flowchart Examples | Lead to opportunity ...
- Basic Flowchart Symbols and Meaning | How to Create a Social ...
- Process Flowchart | HR Flowchart Symbols | Human Resource ...
- Marketing and Sales Organization chart. Organization chart Example
- Sales Process Flowchart . Flowchart Examples | Sales Process ...