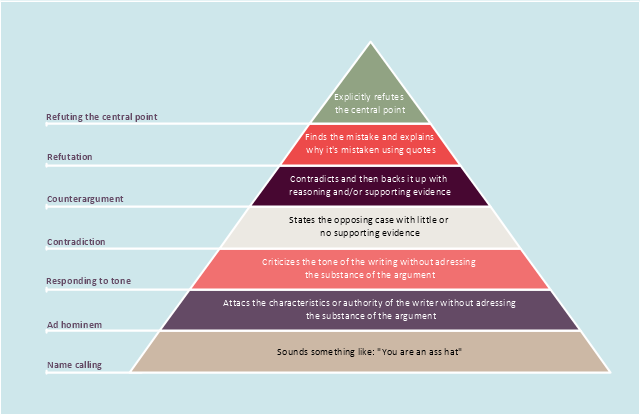
"Graham proposed a "disagreement hierarchy" in a 2008 essay "How to Disagree", putting types of argument into a seven-point hierarchy and observing that "If moving up the disagreement hierarchy makes people less mean, that will make most of them happier."
Although originally written as a simple list, Graham's hierarchy can be represented as a pyramid with the most convincing form of disagreement at the top, and the weakest at the bottom.
Graham notes that articulate forms of name-calling ("The author is a self-important dilettante.") are no different from crude insults, in this hierarchy." [Paul Graham (computer programmer). Wikipedia]
The pyramid diagram example "Graham's hierarchy of disagreement" was redesigned using the ConceptDraw PRO diagramming and vector drawing software from Wikimedia Commons file Graham's Hierarchy of Disagreement.svg. [commons.wikimedia.org/ wiki/ File:Graham's Hierarchy of Disagreement.svg]
The triangle chart example "Graham's hierarchy of disagreement" is included in the Pyramid Diagrams solution from the Marketing area of ConceptDraw Solution Park.
Pyramid diagram
Pyramid Diagram

Pyramid Diagram

Pyramid Diagram

Marketing Flow Chart

Business Report Pie. Pie Chart Examples

How to Prepare Learning Presentations for Training
How to Create Presentation of Your Project Gantt Chart

Online Collaboration via Skype


How to Present Workflow to Team
How to Create a Cross Functional Flow Chart

Different Segments of An EPC
How to Create a Social Media DFD Flowchart

How to Create a Pyramid Diagram

Business Process Management
- Graham's hierarchy of disagreement - Pyramid diagram | Pyramid ...
- Pyramid Diagram | Graham's hierarchy of disagreement - Pyramid ...
- Hierarchy Pyramid
- Knowledge hierarchy triangle diagram | Pyramid Diagram | Pyramid ...
- Horizontal Process Funnel Powerpoint Template
- Hierarchical Network Topology | Venn Diagram Examples for ...
- Pyramid Diagram | Pyramid Diagram | How to Create a Pyramid ...
- Football pitch metric | Pyramid Diagram | Football fields - Vector ...
- Pyramid Charts | Pyramid Diagram | Pyramid Diagram | Essay On ...
- How to Draw a Pyramid Diagram in ConceptDraw PRO | Pyramid ...
- Basketball Court Diagram and Basketball Positions | Pyramid ...
- How to Create a Pyramid Diagram
- Pyramid Diagram | Entity Relationship Diagram Symbols | How To ...
- Pyramid Diagram | Knowledge hierarchy triangle diagram | Pyramid ...
- Chart For Triangular Pyramid
- Sport Field Plans | How to Make Soccer Position Diagram Using ...
- Diagram Of A Triangular Pyramid
- Venn Diagram Examples for Problem Solving. Computer Science ...
- Soccer (Football) Positions | Baseball Diagram – Basic Bunt ...