Horizontal Flowchart

Horizontal Org Flow Chart

Horizontal Orgchart

How to Create a Bar Chart

HelpDesk
How to Create a Bar Chart in ConceptDraw PRO

Bar Chart Software

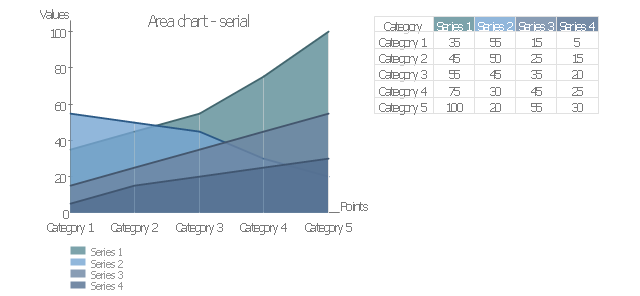
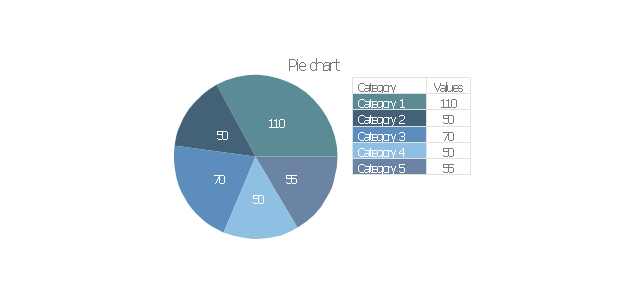
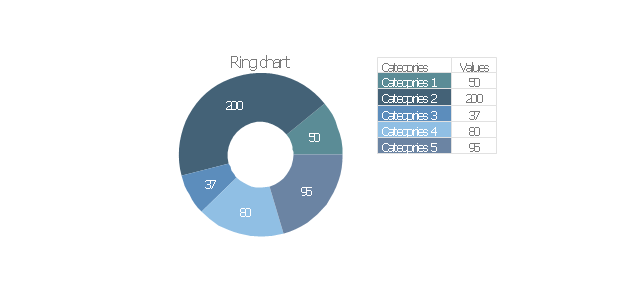
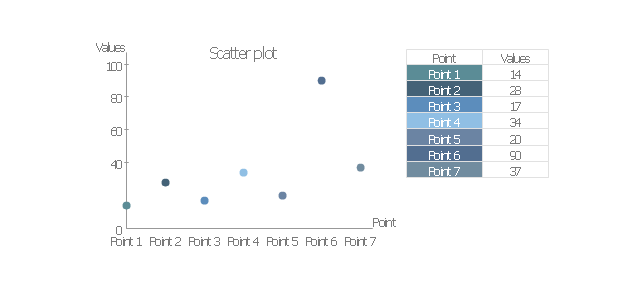
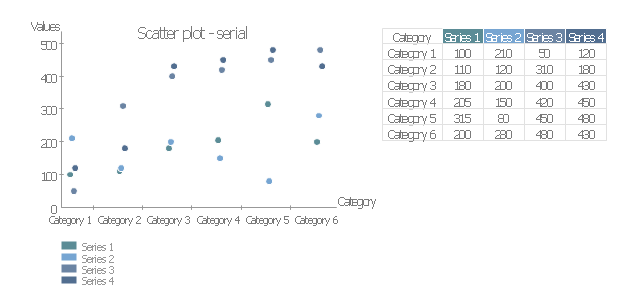
The vector stencils library "Education charts" contains 12 graphs and charts: area chart, column chart, divided bar diagram, histogram, horizontal bar graph, line graph, pie chart, ring chart, scatter plot.
Use it to create your education infogram in the ConceptDraw PRO diagramming and vector drawing software.
The vector stencils library "Education charts" is included in the Education Infographics solution from the Business Infographics area of ConceptDraw Solution Park.
Use it to create your education infogram in the ConceptDraw PRO diagramming and vector drawing software.
The vector stencils library "Education charts" is included in the Education Infographics solution from the Business Infographics area of ConceptDraw Solution Park.
Area chart - serial

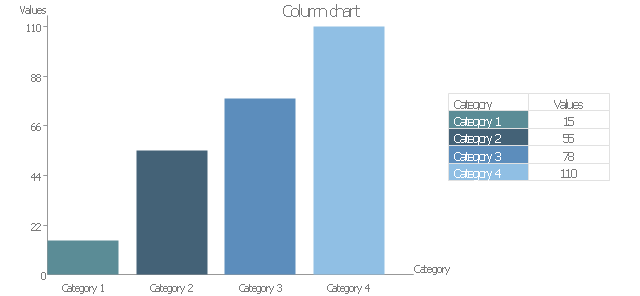
Column chart

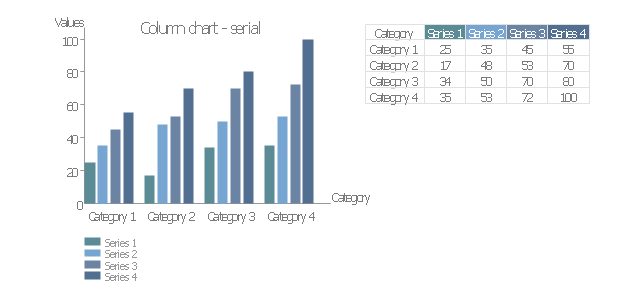
Column chart - serial

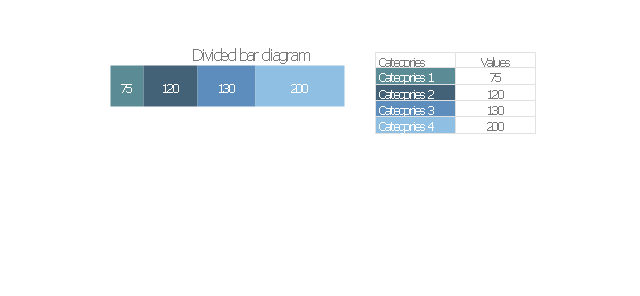
Divided bar diagram

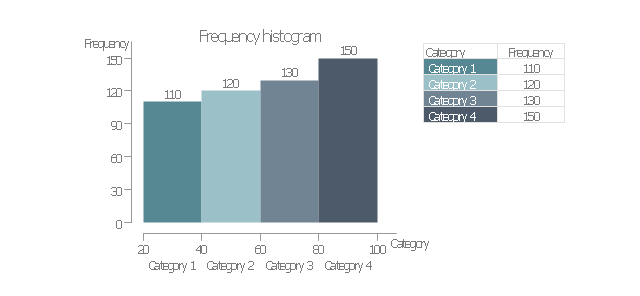
Frequency histogram

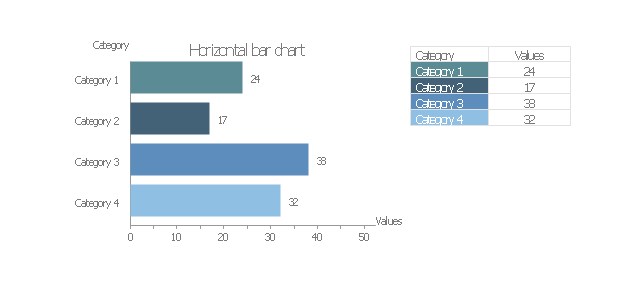
Horizontal bar chart

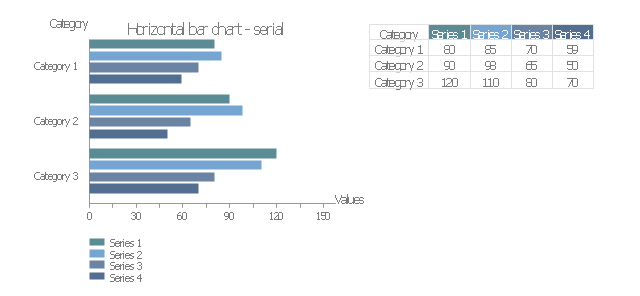
Horizontal bar chart - serial

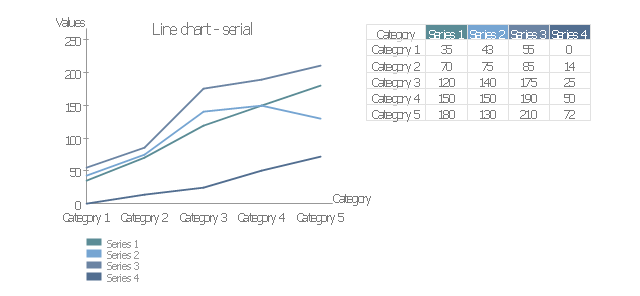
Line chart - serial

Pie chart

Ring chart

Scatter plot

Scatter plot - serial

Bar Chart Examples

Cross-Functional Flowchart


The vector stencils library "Management charts" contains 12 graphs and charts: area chart, column chart, divided bar diagram, histogram, horizontal bar graph, line graph, pie chart, ring chart, scatter plot.
Use it to create your management infogram in the ConceptDraw PRO diagramming and vector drawing software.
The graphs example "Management charts - Vector stencils library" is included in the solution "Marketing infographics" from the "Business infographics" area of ConceptDraw Solution Park.
Use it to create your management infogram in the ConceptDraw PRO diagramming and vector drawing software.
The graphs example "Management charts - Vector stencils library" is included in the solution "Marketing infographics" from the "Business infographics" area of ConceptDraw Solution Park.
Area chart - serial
Column chart
Column chart - serial
Divided bar diagram
Frequency histogram
Horizontal bar chart
Horizontal bar chart - serial
Line chart - serial
Pie chart
Ring chart
Scatter plot
Scatter plot - serial
How to Create a Line Chart

How to Create a Scatter Chart

How to Create a Column Chart

The vector stencils library "Bar charts" contains 7 templates of bar and column charts for visualizing quantitative and statistical data comparison and changes in time series. Drag template from library to your document and enter your data.
Use these shapes to draw your bar graphs in the ConceptDraw PRO diagramming and vector drawing software.
The vector stencils library "Bar charts" is included in the Bar Graphs solution from the Graphs and Charts area of ConceptDraw Solution Park.
Use these shapes to draw your bar graphs in the ConceptDraw PRO diagramming and vector drawing software.
The vector stencils library "Bar charts" is included in the Bar Graphs solution from the Graphs and Charts area of ConceptDraw Solution Park.
Vertical bar chart

Horizontal bar chart

3D bar chart

Cylindrical bar chart

Double bar chart

Column chart - serial

Horizontal bar chart - serial

Coordinate system 3D

The vector stencils library "Bar charts" contains 7 templates of bar and column charts for visualizing quantitative and statistical data comparison and changes in time series. Drag template from library to your document and enter your data.
Use these shapes to draw your bar graphs in the ConceptDraw PRO diagramming and vector drawing software.
The vector stencils library "Bar charts" is included in the Bar Graphs solution from the Graphs and Charts area of ConceptDraw Solution Park.
Use these shapes to draw your bar graphs in the ConceptDraw PRO diagramming and vector drawing software.
The vector stencils library "Bar charts" is included in the Bar Graphs solution from the Graphs and Charts area of ConceptDraw Solution Park.
Vertical bar chart
Horizontal bar chart
3D bar chart
Cylindrical bar chart
Double bar chart
Column chart - serial
Horizontal bar chart - serial
Coordinate system 3D
- Horizontal Org Flow Chart | Horizontal Orgchart | Organizational ...
- Horizontal Flowchart | Horizontal Org Flow Chart | Cross-Functional ...
- Horizontal Flowchart | Horizontal Org Flow Chart | Process Flowchart ...
- Bar Chart Software | Horizontal Flowchart | Design elements ...
- Horizontal Orgchart | 25 Typical Orgcharts | Organization Chart ...
- Bar Chart Software | Bar Chart Examples | Bar Graphs | Horizontal ...
- Business Board Org Chart | Org Chart Diagram | Horizontal Org Flow ...
- Horizontal Org Flow Chart | Process Flowchart | Flowchart Software ...
- Bar Chart Examples | Vertical Cross Functional Flowchart ...
- Horizontal Bar Charts To Download
- Horizontal Bar Chart Is Sometimes Called As Which Chart
- Business Board Org Chart | Organization Chart Templates ...
- Organizational Chart Templates | Horizontal Org Flow Chart ...
- Bar Chart Examples | Chart Maker for Presentations | Bar Chart ...
- Bar Chart Examples | Chart Templates | Chart Examples | Horizontal ...
- Horizontal Org Flow Chart | Horizontal Orgchart | Cross Functional ...
- Bar Chart Examples | Bar Graphs | Bar Chart Software | Business ...
- Horizontal Flowchart | Horizontal Org Flow Chart | Horizontal Cross ...
- Organization chart - Foodbank | Organizational Charts | Horizontal ...
- Example of Organizational Chart | Organizational Charts | Horizontal ...