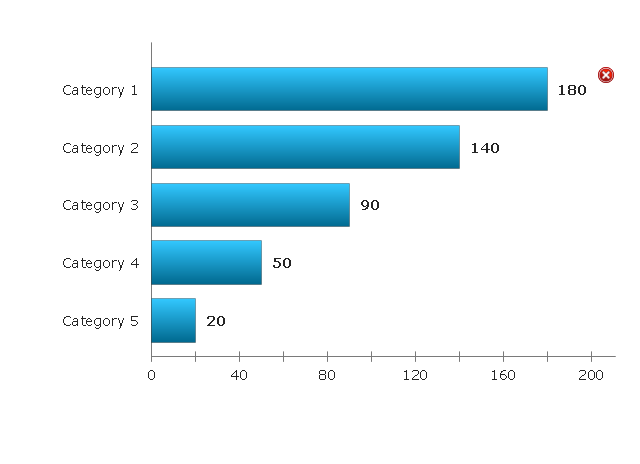
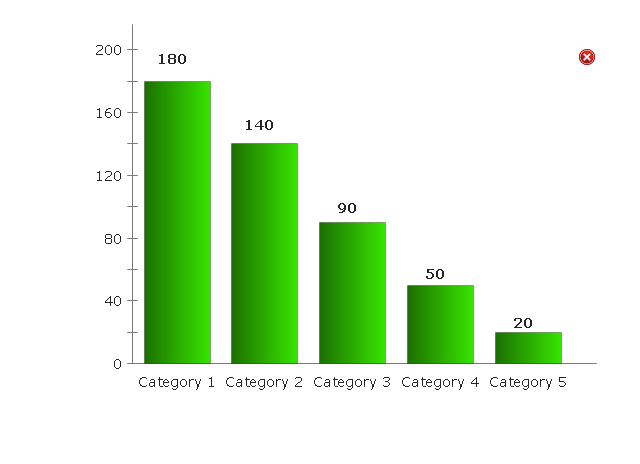
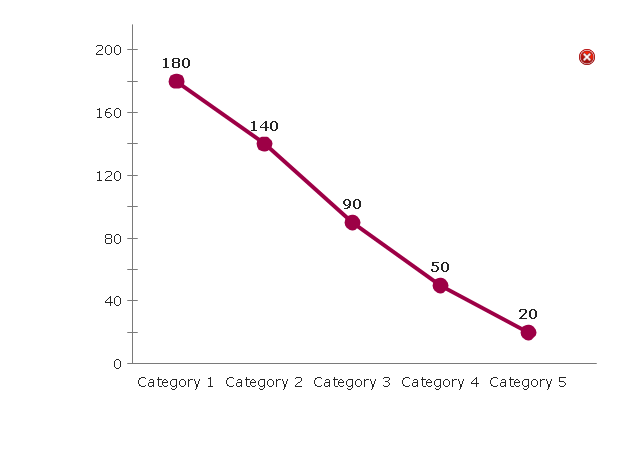
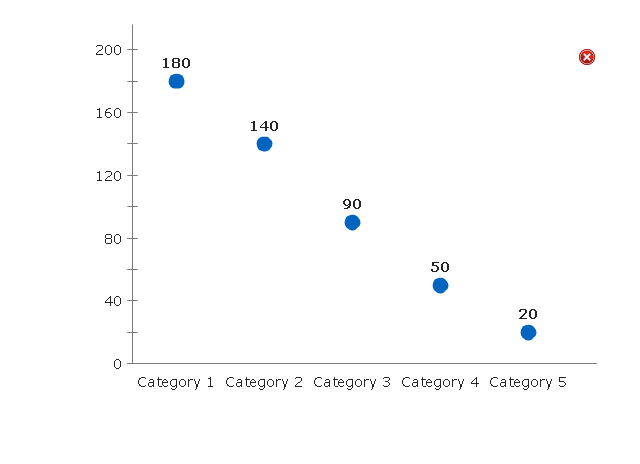
The vector stencils library "Comparison charts" contains 4 Live Objects: Horizontal bar chart template, Column chart (Vertical bar chart) template, Line chart template and Dot plot (Scatter chart) template.
Use it for drawing visual dashboards in the ConceptDraw PRO diagramming and vector drawing software extended with the Comparison Dashboard solution from the area "What is a Dashboard" of ConceptDraw Solution Park.
www.conceptdraw.com/ solution-park/ comparison-dashboard
Use it for drawing visual dashboards in the ConceptDraw PRO diagramming and vector drawing software extended with the Comparison Dashboard solution from the area "What is a Dashboard" of ConceptDraw Solution Park.
www.conceptdraw.com/ solution-park/ comparison-dashboard
Horizontal Bar Chart
Column Chart
Line Chart
Dot Plot
Use this vertical bar chart template to design your column charts in the ConceptDraw PRO diagramming and vector drawing software.
"Bar graphs can ... be used for more complex comparisons of data with grouped bar charts and stacked bar charts. In a grouped bar chart, for each categorical group there are two or more bars. These bars are color-coded to represent a particular grouping. For example, a business owner with two stores might make a grouped bar chart with different colored bars to represent each store: the horizontal axis would show the months of the year and the vertical axis would show the revenue. Alternatively, a stacked bar chart could be used. The stacked bar chart stacks bars that represent different groups on top of each other. The height of the resulting bar shows the combined result of the groups. However, stacked bar charts are not suited to datasets where some groups have negative values. In such cases, grouped bar charts are preferable." [Bar chart. Wikipedia]
The column chart template "Double bar graph" is included in the Basic Bar Graphs solution from the Graphs and Charts area of ConceptDraw Solution Park.
Template

- Bar Chart Template for Word | Column Chart Template | Bar Chart ...
- Bar Graphs | Design elements - Picture bar graphs | Double bar ...
- Bar Graphs | Bar Graph | Double bar graph - Template | _bar Graph_
- Bar Graphs | Marketing infogram 3 - Template | Basic Bar Graphs ...
- Bar Chart Template for Word | Double bar graph - Template | Bar ...
- Bar Chart Software | Bar Graphs | Bar Chart Examples | Horizontal ...
- Horizontal Bar Graph Png
- Double bar graph - Template | Bar Graph | Bar Chart Software ...
- Double bar graph - Template | Basic Bar Graphs | Bar Graphs ...