Architecture Diagrams

Object-Oriented Design

Entity Relationship Diagram - ERD - Software for Design Crows Foot ER Diagrams
_Win_Mac.png "Entity Relationship Diagram - ERD - Software for Design <br>Crows Foot ER Diagrams *")

 Block Diagrams
Block Diagrams solution with the pre-made templates, samples and stencil libraries full of vector elements can be used for drawing any needed Block diagram, Functional block diagram, or Block flow diagram. Using the created block diagrams for visualizing the high-levelled concepts of engineering, software system design and business, any business owner has a chance to succeed in doing what he is meant to. Many business specialists, business owners, and project managers will find the ConceptDraw DIAGRAM block diagram creator with Block Diagrams solution useful for drawing the 2D and 3D Block diagrams as using the pre-designed objects.
Design Element: Cisco for Network Diagrams


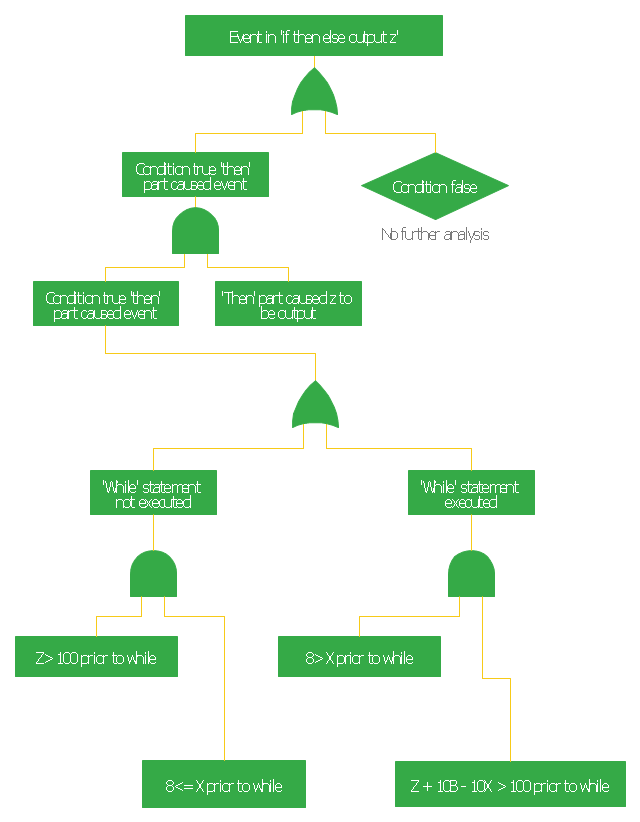
This FTA diagram example was redesigned from the Wikipedia Commons file: Example Code Fault Tree.jpg. [commons.wikimedia.org/ wiki/ File:Example_ Code_ Fault_ Tree.jpg]
"Use of Software Fault Tree Analysis.
Any SFTA must be preceded by a hazard analysis of the entire system. The information in the hazard analysis identifies those undesired events in the system that can cause serious consequences. It should be noted that in comple x systems not all hazards can be predetermined.
In this respect the technique does not claim to produce consistent results irrespective of the analyst. It is dependent on the judgment of the individual as to when to stop the process and which hazards to analyze.
The SFTA can be used at different stages of the software life cycle, beginning at the software requirements phase. At that early stage, only the bare minimum of the software will be defined, though the system will usually have a preliminary design. Only a very high-level SFTA will be able to be performed. However, as the software design progresses, and the code is developed, the SFTA can be “fleshed out” with the new information. High-level blocks can be broken down into specific components (modules, classes, methods, etc.)." [NASA Software Safety Guidebook. hq.nasa.gov/ office/ codeq/ doctree/ 871913.pdf]
The FTA diagram example "Code fault tree" was created using the ConceptDraw PRO diagramming and vector drawing software extended with the Fault Tree Analysis Diagrams solution from the Engineering area of ConceptDraw Solution Park.
Fault tree diagram
 AWS Architecture Diagrams
AWS Architecture Diagrams with powerful drawing tools and numerous predesigned Amazon icons and AWS simple icons is the best for creation the AWS Architecture Diagrams, describing the use of Amazon Web Services or Amazon Cloud Services, their application for development and implementation the systems running on the AWS infrastructure. The multifarious samples give you the good understanding of AWS platform, its structure, services, resources and features, wide opportunities, advantages and benefits from their use; solution’s templates are essential and helpful when designing, description and implementing the AWS infrastructure-based systems. Use them in technical documentation, advertising and marketing materials, in specifications, presentation slides, whitepapers, datasheets, posters, etc.
 Jackson Structured Programming (JSP) Diagrams
The Jackson Structured Programming (JSP) Diagram solution extends the functionality and drawing abilities of the ConceptDraw DIAGRAM software with set of illustrative JSP diagrams samples and large variety of predesigned vector objects of actions, processes, procedures, selection, iteration, as well as arrows and connectors to join the objects during Jackson structured development and designing Jackson structured programming diagrams, JSP diagram, Jackson structure diagram (JSD), Program structure diagram. The powerful abilities of this solution make the ConceptDraw DIAGRAM ideal assistant for programmers, software developers, structural programmers, computer engineers, applications constructors, designers, specialists in structured programming and Jackson systems design, and other technical, computer and software specialists.
How to Design a Good Workflow

How to Design a Good Workflow
Interior Design. Site Plan — Design Elements

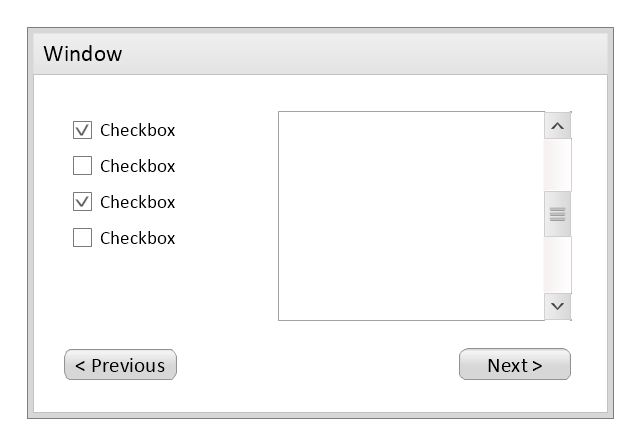
Use this template to prototype and design the wireframe graphic user interface (GUI).
"A website wireframe, also known as a page schematic or screen blueprint, is a visual guide that represents the skeletal framework of a website. Wireframes are created for the purpose of arranging elements to best accomplish a particular purpose. The purpose is usually being informed by a business objective and a creative idea. The wireframe depicts the page layout or arrangement of the website’s content, including interface elements and navigational systems, and how they work together. The wireframe usually lacks typographic style, color, or graphics, since the main focus lies in functionality, behavior, and priority of content. In other words, it focuses on what a screen does, not what it looks like. Wireframes can be pencil drawings or sketches on a whiteboard, or they can be produced by means of a broad array of free or commercial software applications. Wireframes are generally created by business analysts, user experience designers, developers, visual designers and other roles with expertise in interaction design, information architecture and user research.
Wireframes focus on:
(1) The kinds of information displayed.
(2) The range of functions available.
(3) The relative priorities of the information and functions.
(4) The rules for displaying certain kinds of information.
(5) The effect of different scenarios on the display.
The website wireframe connects the underlying conceptual structure, or information architecture, to the surface, or visual design of the website. Wireframes help establish functionality, and the relationships between different screen templates of a website. An iterative process, creating wireframes is an effective way to make rapid prototypes of pages, while measuring the practicality of a design concept. Wireframing typically begins between “high-level structural work - like flowcharts or site maps - and screen designs.” Within the process of building a website, wireframing is where thinking becomes tangible.
Aside from websites, wireframes are utilized for the prototyping of mobile sites, computer applications, or other screen-based products that involve human-computer interaction." [Website wireframe. Wikipedia]
The wireframe GUI template for the ConceptDraw PRO diagramming and vector drawing software is included in the Graphic User Interface solution from the Software Development area of ConceptDraw Solution Park.
Wireframe GUI template
Flowchart Definition

The vector stencils library "Meter indicators" contains 29 Live Objects: speedometer gauge, dial, bullet graph, slider and level meter visual indicators.
The Live Objects designed to display actual measures of performance metrics and KPIs from external data source files.
Some of them also display comparative measures, and colored zones of qualitative ranges with legend.
Use it to draw business performance dashboards using the ConceptDraw PRO diagramming and vector drawing software .
"Digital dashboards may be laid out to track the flows inherent in the business processes that they monitor. Graphically, users may see the high-level processes and then drill down into low level data. This level of detail is often buried deep within the corporate enterprise and otherwise unavailable to the senior executives. ...
Specialized dashboards may track all corporate functions. Examples include human resources, recruiting, sales, operations, security, information technology, project management, customer relationship management and many more departmental dashboards. ...
Like a car's dashboard (or control panel), a software dashboard provides decision makers with the input necessary to "drive" the business. Thus, a graphical user interface may be designed to display summaries, graphics (e.g., bar charts, pie charts, bullet graphs, "sparklines," etc.), and gauges (with colors similar to traffic lights) in a portal-like framework to highlight important information. ...
Digital dashboards allow managers to monitor the contribution of the various departments in their organization. To gauge exactly how well an organization is performing overall, digital dashboards allow you to capture and report specific data points from each department within the organization, thus providing a "snapshot" of performance." [Dashboard (management information systems). Wikipedia]
The example "Design elements - Meter indicators" is included in the Meter Dashboard solution from the area "What is a Dashboard" of ConceptDraw Solution Park.
Visual indicators

Influence Diagram Software

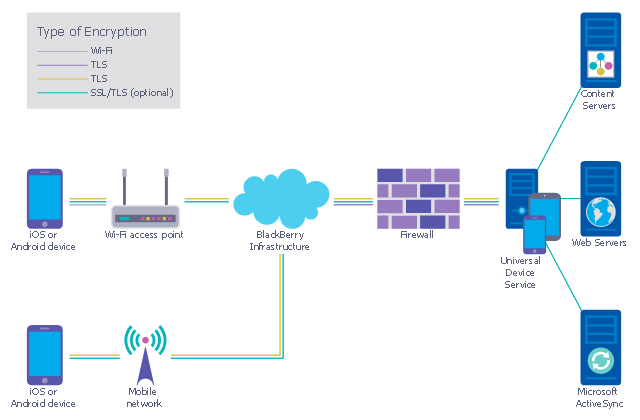
This example was designed on the base of the diagram from the "BYOD Guidance: BlackBerry Secure Work Space" on the website of the UK Communications Electronics Security Group (CESG).
"Secure Work Space (SWS) for iOS and Android is a containerisation, application-wrapping and secure connectivity option that delivers a higher level of control and security to iOS and Android devices, all managed through the BlackBerry Enterprise Service (BES) administration console.
Work space applications are secured and separated from personal applications and data. The work space applications include an integrated email, calendar, and contacts application, an enterprise-level secure browser, and a secure document viewing and editing application.
The work browser allows users to securely browse the organisation’s intranet and the Internet. If the device is lost or the employee leaves the organisation, you can chose to delete only corporate information or all information from the device.
...
Recommended network architecture
The walled garden architecture, shown below, aims to limit the impact of a compromise of an EUD and isolate high risk components from high value components where possible. The enterprise servers installed as part of SWS are high value resources that require suitable protection but are also high risk; they perform complex processing tasks that are more likely to contain exploitable vulnerabilities. These competing priorities make securely placing the servers into an existing network challenging, and organisations that wish to deviate from this architecture below should ensure they understand the risks of doing so."
[cesg.gov.uk/ guidance/ byod-guidance-blackberry-secure-work-space]
The cybersecurity diagram example "Recommended network architecture for BlackBerry SWS" was created using the ConceprDraw PRO software extended with the Network Security Diagrams solution from the Computer and Neworks area of ConceptDraw Solution Park.
Computer security diagram
Network Security Architecture Diagram

Program Structure Diagram

This example was redesigned from the Wikimedia Commons file: Example of High Level Fault Tree.jpg. [commons.wikimedia.org/ wiki/ File:Example_ of_ High_ Level_ Fault_ Tree.jpg]
"Risk assessment is the determination of quantitative or qualitative value of risk related to a concrete situation and a recognized threat (also called hazard). Quantitative risk assessment requires calculations of two components of risk (R):, the magnitude of the potential loss (L), and the probability (p) that the loss will occur. Acceptable risk is a risk that is understood and tolerated usually because the cost or difficulty of implementing an effective countermeasure for the associated vulnerability exceeds the expectation of loss.
In all types of engineering of complex systems sophisticated risk assessments are often made within Safety engineering and Reliability engineering when it concerns threats to life, environment or machine functioning. The nuclear, aerospace, oil, rail and military industries have a long history of dealing with risk assessment. Also, medical, hospital, social service and food industries control risks and perform risk assessments on a continual basis. Methods for assessment of risk may differ between industries and whether it pertains to general financial decisions or environmental, ecological, or public health risk assessment." [Risk assessment. Wikipedia]
The FTA diagram example "High level fault tree" was created using the ConceptDraw PRO diagramming and vector drawing software extended with the Fault Tree Analysis Diagrams solution from the Engineering area of ConceptDraw Solution Park.
FTA diagram

- Cloud Computing Architecture Diagrams | AWS Architecture ...
- AWS Architecture Diagrams | Business Architecture | Cloud ...
- Fault Tree Analysis Diagrams | High Level Solution Architecture Of ...
- Architecture Diagrams | High Level System Architecture Diagram
- Computer Network Architecture . Computer and Network Examples ...
- High level fault tree | SWOT and TOWS Matrix Diagrams | Data ...
- High level fault tree | Design Element: Rack Diagram for Network ...
- Cloud Computing Architecture Diagrams | Diagramming software for ...
- Network Security Architecture Diagram | Enterprise Architecture ...