Pyramid Diagram

Pyramid Diagram

Pyramid Diagram

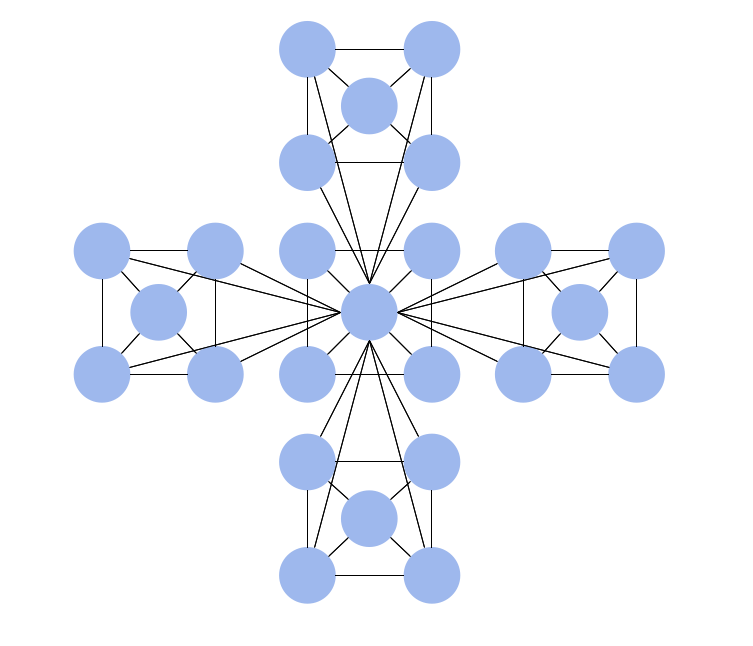
Hierarchical Network Topology
This example of a Top Level Context Diagram for an information system management process was redesigned from the Wikipedia file: IDEF Top-Level Context Diagram.jpg. [en.wikipedia.org/ wiki/ File:IDEF_ Top-Level_ Context_ Diagram.jpg]
"Graphical notation.
IDEF0 is a model that consists of a hierarchical series of diagrams, text, and glossary cross referenced to each other. The two primary modeling components are:
(1) functions (represented on a diagram by boxes), and
(2) data and objects that interrelate those functions (represented by arrows).
... the position at which the arrow attaches to a box conveys the specific role of the interface. The controls enter the top of the box. The inputs, the data or objects acted upon by the operation, enter the box from the left. The outputs of the operation leave the right-hand side of the box. Mechanism arrows that provide supporting means for performing the function join (point up to) the bottom of the box.
The IDEF0 process.
The IDEF0 process starts with the identification of the prime function to be decomposed. This function is identified on a “Top Level Context Diagram,” that defines the scope of the particular IDEF0 analysis. ... From this diagram lower-level diagrams are generated." [IDEF0. Wikipedia]
The IDEF0 diagram example "Top-level context diagram" was created using the ConceptDraw PRO diagramming and vector drawing software extended with the IDEF0 Diagrams solution from the Software Development area of ConceptDraw Solution Park.
IDEF0 diagram

IDEF0 Visio

 IDEF Business Process Diagrams
Use the IDEF Business Process Diagrams solution to create effective database designs and object-oriented designs, following the integration definition methodology.
Pyramid Diagram

Types of Flowcharts


Process Flowchart


- Types Of Information System Based On Hierarchy
- Management Information System Types Based On Functions And
- Types Of Information System In Hierarchical Form
- 4 Level pyramid model diagram - Information systems types ...
- Management Information System
- Models Of Functional Information System In Mis
- Pyramid Diagrams | Draw The Model Of Marketing Information System
- Three Levels Of Hierachy In Management Information System
- 4 Level pyramid model diagram - Information systems types | Control ...
- 5 Level pyramid model diagram - Information systems types | 4 Level ...