HelpDesk
How to Edit Grouped Shapes in ConceptDraw PRO on Windows
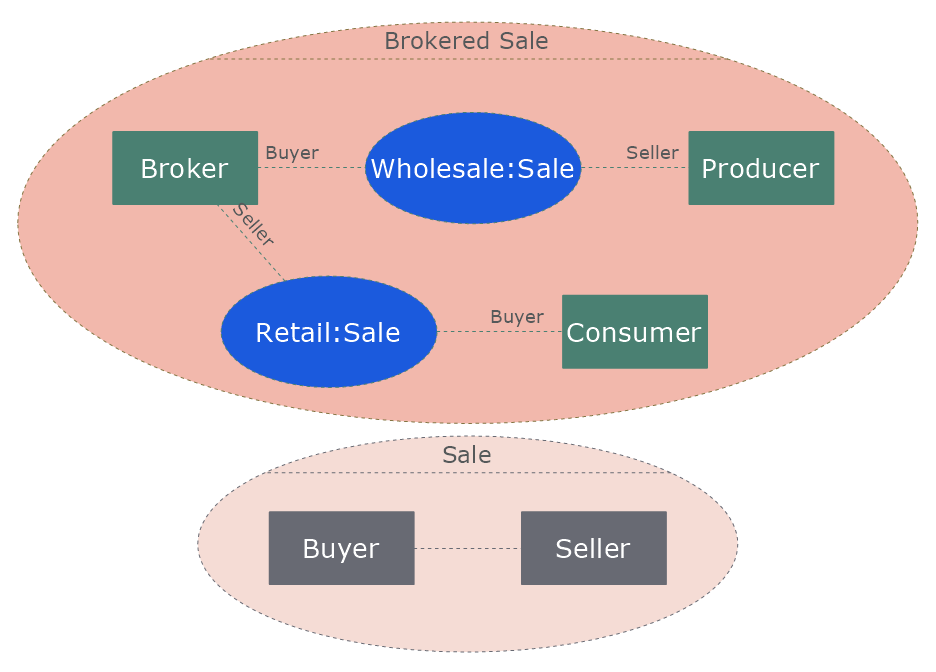
ConceptDraw PRO allows one to group objects. Grouping shapes, pictures, or objects lets you style, format, rotate, and move them together, as though they were a single object. At the same time, you can edit each of them separately.HelpDesk
How to Edit Grouped Shapes in ConceptDraw PRO on OS X
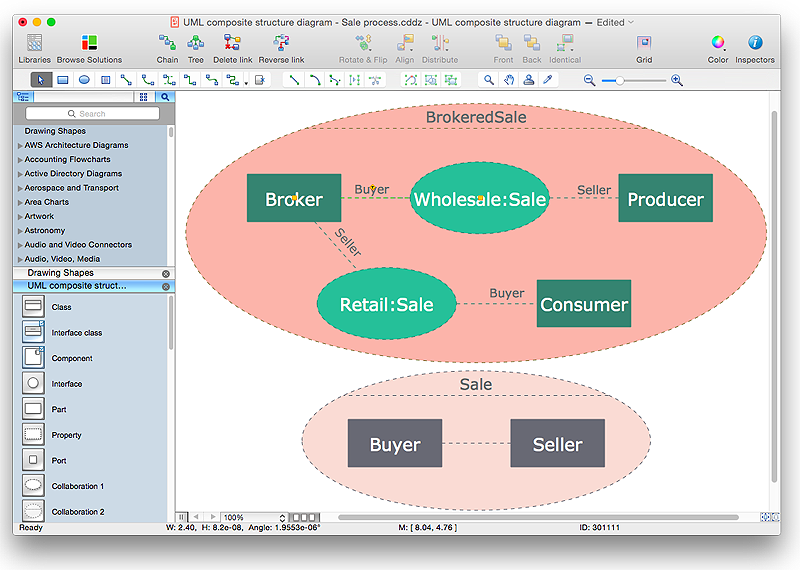
ConceptDraw PRO offers a range of built-in facilities in order to enable you to quickly edit any diagram or other visualization made using ConceptDraw PRO, or MS Visio. Grouping shapes, pictures, or objects lets you style, format, rotate, and move them together, as though they were a single object.ConceptDraw Arrows10 Technology
ConceptDraw Arrows10 Technology - This is more than enough versatility to draw any type of diagram with any degree of complexity.
 Business Process Mapping
The Business Process Mapping solution for ConceptDraw PRO is for users involved in process mapping and creating SIPOC diagrams.
HelpDesk
How to Create an AWS Architecture Diagram
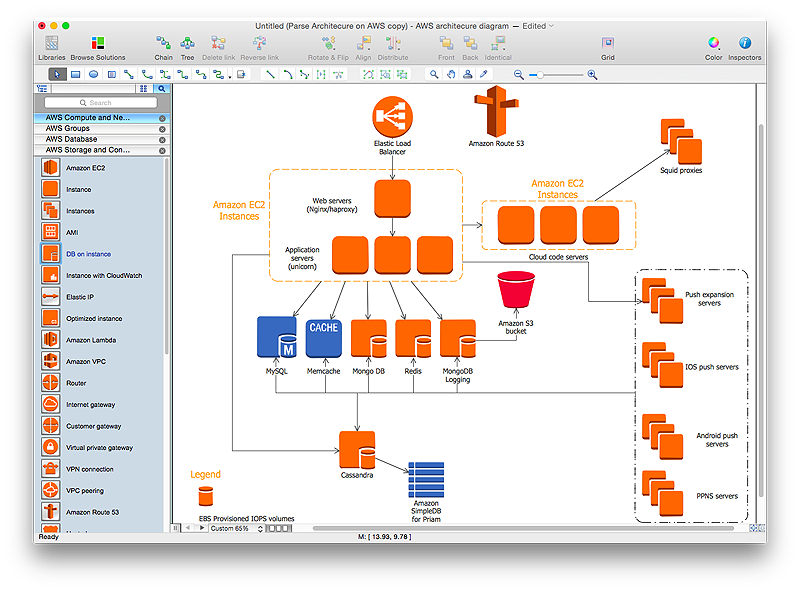
Displaying an Amazon Web Service (AWS) cloud actually requires large amounts of attention to detail. Every element of technology has to be addressed: software, middle ware, transaction processing, scaling, data storage; the complete list is staggering. Using the ConceptDraw AWS Architecture Diagrams solution makes much easier the work on documenting the Amazon Web Service architecture. The ConceptDraw AWS Architecture Diagrams solution includes icons, sample and templates for some Amazon Web Services products and resources, to be used when buiding architecture diagrams. The icons are simple so that user can easily incorporate them in his drawings. AWS Architecture Diagrams can be used in presentations, datasheets, or any other technical visualizations.ConceptDraw Arrows10 Technology
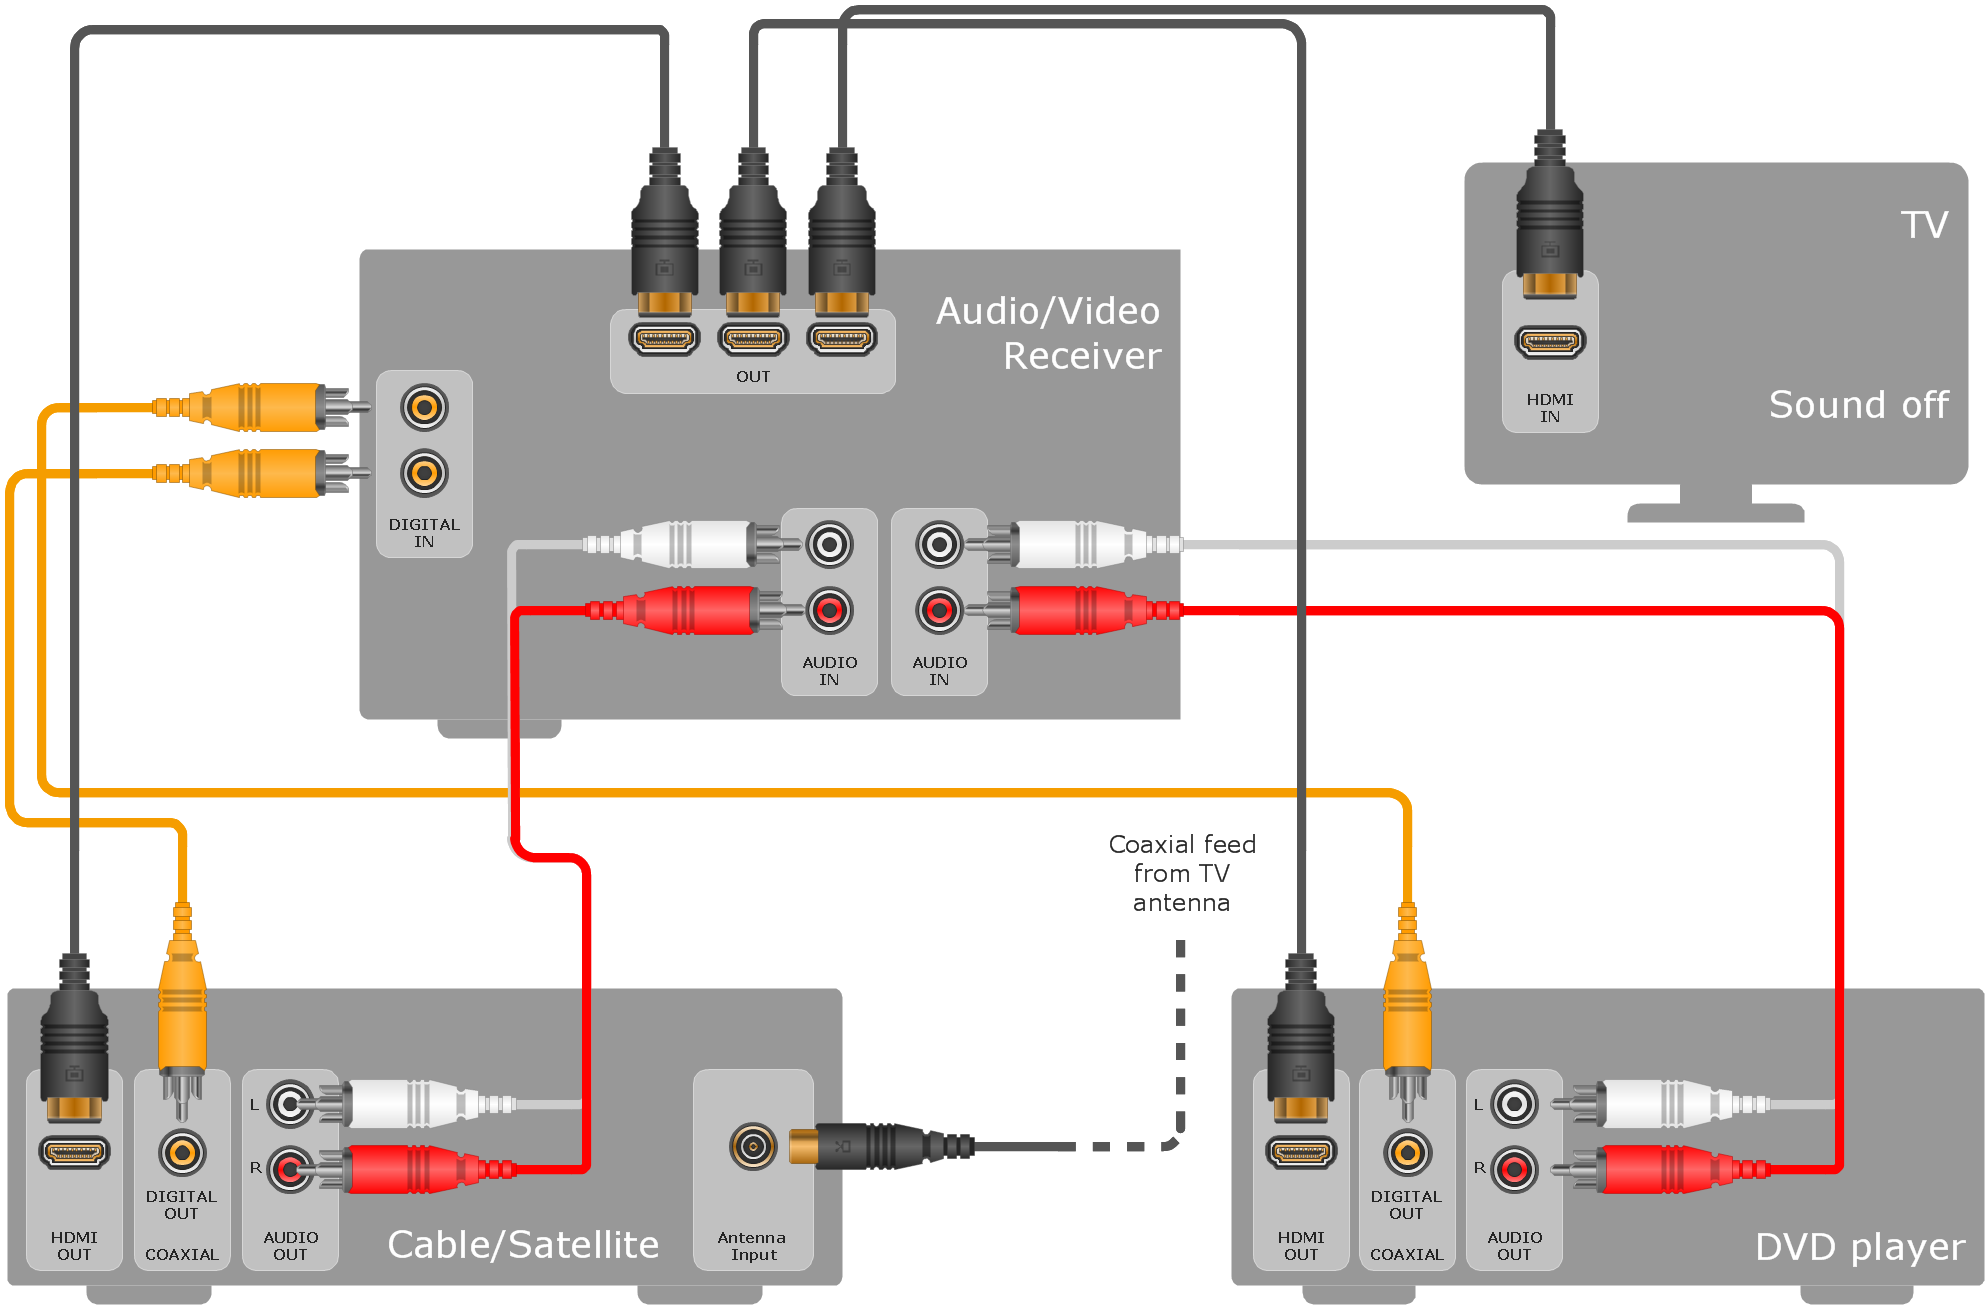
You can see that when you rotate a group, connectors change their angle, keeping their position inside of the grouped objects. If you decide to ungroup the objects, the connectors will adjust to keep lines parallel to the edges of the sheet. The magic of ConceptDraw Arrows10’s rotating group containing connectors, makes complex diagramming simple and easy. The way to connect objects has never been easier.HelpDesk
How to Create a Cloud Computing Diagram Using ConceptDraw PRO
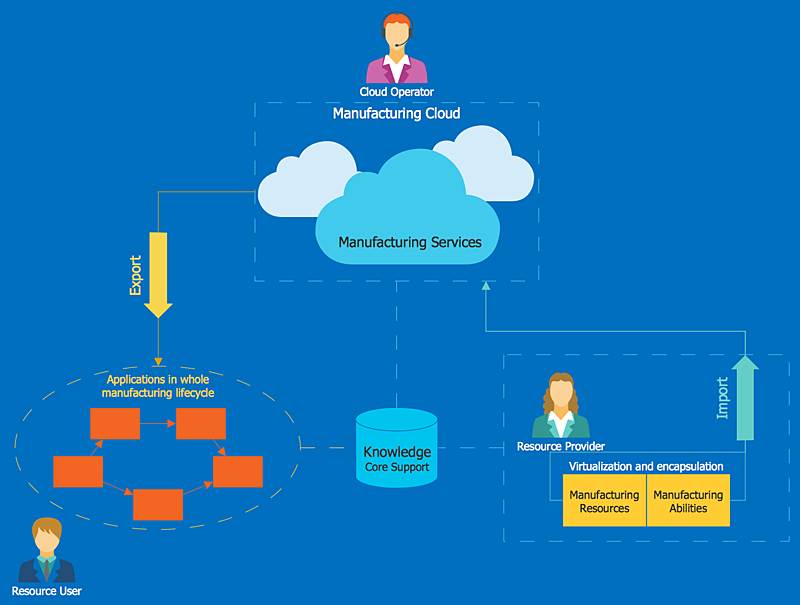
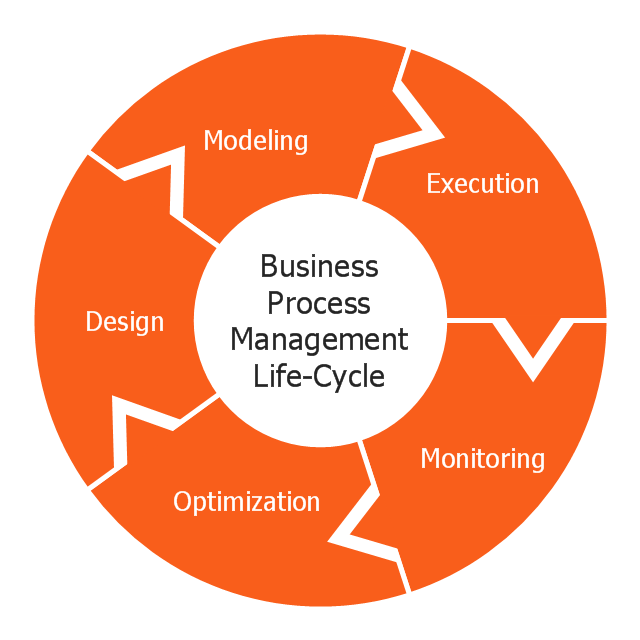
Cloud computing is a model of remote access to shared computing resources that are physically distributed in many remote devices. Cloud Computing is a technology that allows to use the Internet to place computing resources and the provision of such services to customers. Using cloud computing means assigning responsibilities on applications and data storage service among special systems, which have a very high level of reliability and unlimited resources. The result is reducing the cost of service, and to providing users with ready-to-use service. ConceptDraw's Cloud Computing Diagrams solution allows you to visualize cloud computing models of any configuration and complexity.This circular arrows diagram sample shows business process management life cycle.
It was designed on the base of the Wikimedia Commons file: Business Process Management Life-Cycle.svg. [commons.wikimedia.org/ wiki/ File:Business_ Process_ Management_ Life-Cycle.svg]
This file is licensed under the Creative Commons Attribution-Share Alike 3.0 Unported license. [creativecommons.org/ licenses/ by-sa/ 3.0/ deed.en]
"BPM life-cycle.
Business process management activities can be grouped into six categories: vision, design, modeling, execution, monitoring, and optimization.
Functions are designed around the strategic vision and goals of an organization. Each function is attached with a list of processes. Each functional head in an organization is responsible for certain sets of processes made up of tasks which are to be executed and reported as planned. Multiple processes are aggregated to function accomplishments and multiple functions are aggregated to achieve organizational goals." [Business process management. Wikipedia]
The arrow donut chart example "BPM life cycle" was created using the ConceptDraw PRO diagramming and vector drawing software extended with the Circular Arrows Diagrams solution from the area "What is a Diagram" of ConceptDraw Solution Park.
- Product life cycle process - Flowchart | EPC diagrams - Vector ...
- How to Edit Grouped Shapes in ConceptDraw PRO on OS X | How ...
- Entity-Relationship Diagram (ERD) | How to Edit Grouped Shapes in ...
- Business Process Management | Circular arrows diagram - BPM life ...
- Total Quality Management TQM Diagrams | How to Create a TQM ...
- Swim Lane Diagrams | Entity-Relationship Diagram (ERD ...
- Flowchart Programming Project. Flowchart Examples | Sample ...
- BPM Software | Circular arrows diagram - BPM life cycle | Business ...
- Product life cycle process
- How to Draw an Organization Chart
- Create a Presentation Using a Design Template | How to Edit ...
- Process Flowchart | Bar Diagrams for Problem Solving. Create event ...
- Product life cycle process - Flowchart | Water cycle diagram | What is ...
- Flow Chart Of Project Management
- Affinity diagram - Template | How To Create an Affinity Diagram ...
- Group
- How to Edit Grouped Shapes in ConceptDraw PRO on Windows ...
- Functional Organizational Structure | Process Flowchart | Event ...
- Business Process Management Diagram Example
- ATM UML Diagrams | How to Make a UML Diagram in ConceptDraw ...
