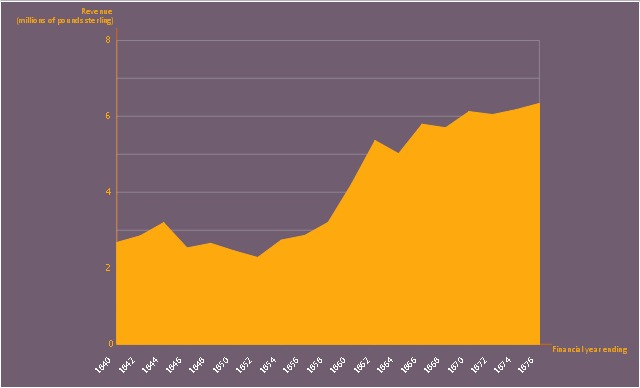
This area chart sample shows the revenue collected by the East India Company (after 1858 the British government) from salt (including inland and port taxes and sale of government salt). It was designed on the base of the Wikimedia Commons file: British India salt revenue 1840-1877.png.
[commons.wikimedia.org/ wiki/ File:British_ India_ salt_ revenue_ 1840-1877.png]
This file is licensed under the Creative Commons Attribution-Share Alike 3.0 Unported license. [creativecommons.org/ licenses/ by-sa/ 3.0/ deed.en]
"The Inland Customs Line which incorporated the Great Hedge of India (or Indian Salt Hedge[1]) was a customs barrier built by the British across India primarily to collect the salt tax. The customs line was begun while India was under the control of the East India Company but continued into the period of direct British rule. The line had its beginnings in a series of customs houses that were established in Bengal in 1803 to prevent the smuggling of salt to avoid the tax. These customs houses were eventually formed into a continuous barrier that was brought under the control of the Inland Customs Department in 1843." [Inland Customs Line. Wikipedia]
The area graph example "British India salt revenue 1840-1877" was created using the ConceptDraw PRO diagramming and vector drawing software extended with the Area Charts solution from the Graphs and Charts area of ConceptDraw Solution Park.
Area chart
 Line Graphs
How to draw a Line Graph with ease? The Line Graphs solution extends the capabilities of ConceptDraw PRO v10 with professionally designed templates, samples, and a library of vector stencils for drawing perfect Line Graphs.
Line Graph

How to Draw a Line Graph

Line Graph Charting Software

How to Create Presentation of Your Project Gantt Chart

 Basic Line Graphs
This solution extends the capabilities of ConceptDraw PRO v10.3.0 (or later) with templates, samples and a library of vector stencils for drawing Line Graphs.
How to Create a Line Chart

Chart Maker for Presentations

Chart Examples

Line Chart Examples

Line Chart Template for Word

The vector stencils library "Line graphs" contains 5 templates of line graphs and scatter charts for visualizing data changes over time. Drag a template from the library to your document and enter your data.
Use these shapes to draw your line and scatter charts in the ConceptDraw PRO diagramming and vector drawing software.
The vector stencils library "Line graphs" is included in the Line Graphs solution from the Graphs and Charts area of ConceptDraw Solution Park.
Use these shapes to draw your line and scatter charts in the ConceptDraw PRO diagramming and vector drawing software.
The vector stencils library "Line graphs" is included in the Line Graphs solution from the Graphs and Charts area of ConceptDraw Solution Park.
Line graph (text -> height)
-line-graphs---vector-stencils-library.png--diagram-flowchart-example.png)
Line graph (control dots)
-line-graphs---vector-stencils-library.png--diagram-flowchart-example.png)
Scatter chart (text -> height)
-line-graphs---vector-stencils-library.png--diagram-flowchart-example.png)
Scatter chart (control dots)
-line-graphs---vector-stencils-library.png--diagram-flowchart-example.png)
Line chart - serial
HelpDesk
How to Draw a Line Chart Quickly

Chart Templates

- Line Chart Template for Word | Line Graph | Chart Maker for ...
- Holiday | Pie Charts | Line Graphs | New Year And Christmas Card ...
- Process Flowchart | How to Draw a Line Graph | Fishbone Diagram ...
- Education charts - Vector stencils library | Line Graph | Line Chart ...
- Basic Line Graphs | Mena Map Png
- Horizontal Bar Graph Png
- Straight Line Png
- Picture graphs - Vector stencils library | Line graphs - Vector stencils ...
- Time Series Graph Png
- Transmission paths - Vector stencils library | Line Graphs | Basic ...
- Line Graph Png
- Professions - Vector stencils library | Line graphs - Vector stencils ...
- Vertical Line Image Png
- Graph Logo Png
- Horizontal Bar Chart Png
- Beautiful Bar Chart Image Png
- Line Graph Icon Png
- Security Plans | Chemistry Symbols and Meanings | Basic Line ...
- Business Productivity - Marketing | Bar Graph | Basic Line Graphs ...