Competitor Analysis

Six Markets Model Chart

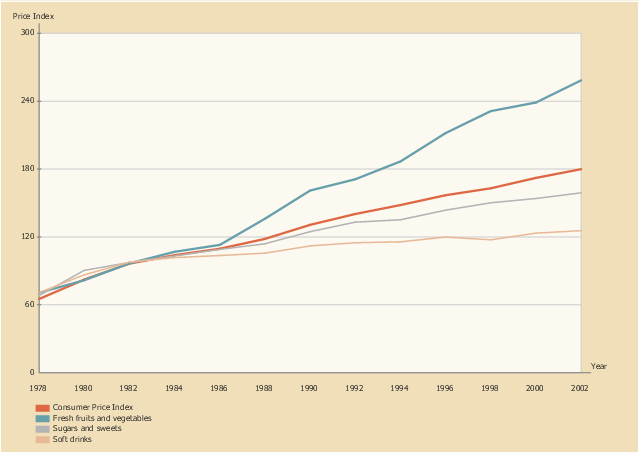
This line graph sample shows the relative price changes for fresh fruits and vegetables, sugars and sweets, and soft drinks, using the period 1982–84 as the baseline (index = 100), 1978–2002. It was designed on the base of line chart from the website of the U.S. National Center for Chronic Disease Prevention and Health Promotion.
"The number of overweight and obese youth has increased in recent decades, yet few data assess how the lives of children have changed during the “obesity epidemic.” ...
Eating as a primary activity declined, suggesting a shift toward snacking or eating as a secondary activity. Statistically significant trends exist for carbohydrate intake, especially for chips/ crackers/ popcorn/ pretzels (intake tripled from the mid-1970s to the mid-1990s) and soft drinks (intake doubled during the same period). Price and income data suggest possible economic reasons for these changes. The percentage of disposable income spent on food has declined continuously, and almost all of the decline has been represented by food consumed at home, yet today’s disposable income buys more calories than it has in the past. Relative prices have encouraged shifts across food types. From a baseline of 100 during 1982–84, the price index for fresh fruit and vegetables increased to 258 by 2002 (far exceeding general inflation), whereas the price index for soft drinks increased only to 126 by 2002 (below general inflation)." [cdc.gov/ pcd/ issues/ 2005/ apr/ 04_ 0039.htm]
The line chart example "Relative price changes for fresh fruits and vegetables, sugars, sweets, soft drinks" was created using the ConceptDraw PRO diagramming and vector drawing software extended with the Line Graphs solution from the Graphs and Charts area of ConceptDraw Solution Park.
Line chart
How to Create a Social Media DFD Flowchart

Social Media Flowchart Symbols

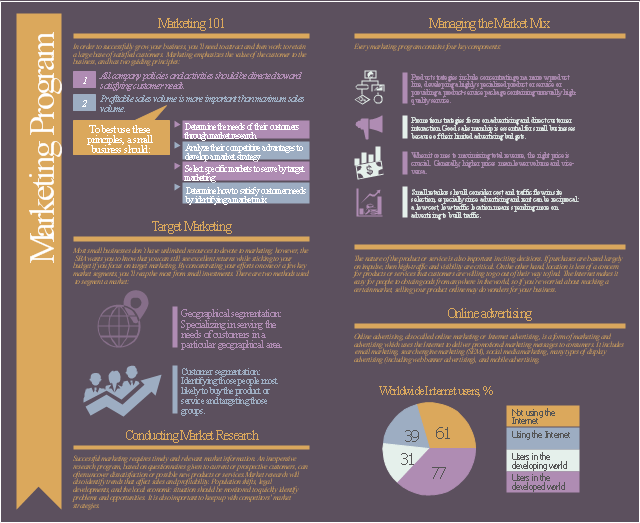
The infogram example "Marketing program" was created on the base of webpages:
(1) Marketing 101. Website of the U.S. Small Business Administration. [sba.gov/ content/ marketing-101-basics]
(2) List of countries by number of Internet users. Wikipedia.
(3) Online advertising. Wikipedia.
"A marketing program is a coordinated, thoughtfully designed set of activities that help you achieve your marketing objectives. Your marketing objectives are strategic sales goals that fit your strengths and are a good way to stretch your business in its current situation. In order to build strong customer relationships and maximize your sales, you need to put every possible marketing tool to work for you. Marketing is a broad field, encompassing elements as diverse as advertising, brand and logo design, sales calls, Web sites, brochures, packaging, shows, conferences and other events, and so on." [dummies.com/ how-to/ content/ designing-your-marketing-program.html]
The infographic example "Marketing program" was created using the ConceptDraw PRO diagramming and vector drawing software extended with the Marketing Infographics solition from the area "Business Infographics" in ConceptDraw Solution Park.
Marketing infogram
Draw Flowcharts with ConceptDraw

Use the Best FlowChart Tool for the Job

Create Process Flowcharts

How to Connect Social Media DFD Flowchart with Action Maps

Flow chart Example. Warehouse Flowchart


Spider Chart Template

This step chart sample shows engineering value chain. It was designed on the base of the Wikimedia Commons file: The engineering value chain.png. "The engineering value chain (EVC) refers to a series of engineering activities and capabilities contributing to value creation encompassing essential elements such as idea generation & selection, design & development, production & delivery, service & support, and disposal & recycling for example." [commons.wikimedia.org/ wiki/ File:The_ engineering_ value_ chain.png]
This file is licensed under the Creative Commons Attribution-Share Alike 3.0 Unported license. [creativecommons.org/ licenses/ by-sa/ 3.0/ deed.en]
The diagram example "Step chart - Value chain" was created using the ConceptDraw PRO diagramming and vector drawing software extended with the Marketing Diagrams solution from the Marketing area of ConceptDraw Solution Park.
Marketing diagram

What Is an Action Mind Map

 Gym and Spa Area Plans
Effective promotion of spa complexes, spa resorts, fitness centers, and gym rooms requires professional, detailed, illustrative and attractive spa floor plan, gym floor plan, and other fitness plans designs. They are designed to display common plans of premises, design, Spa furniture, gym and exercise equipment layout, and pools location.
- Marketing Diagrams | Promotion Mix Chart Or Graph
- Marketing Diagrams | Promotional Mix Graph
- Promotion Mix Graphs For Projects
- Marketing Diagrams | Promotion Mix Chart
- The Promotion Mix
- Promotion Mix
- How to Draw a Pie Chart Using ConceptDraw PRO | Content ...
- Diagrams For Promotion
- Diagram On Promotion Mix
- Marketing And Marketing Mix Graphs
- Six Elements Of Promotion Mix
- Marketing program - Infographics | Donut Chart Templates ...
- Flow Chart Depecting Promotion Mix
- Marketing mix - Wheel diagram | Target diagrams - Vector stencils ...
- Sales Promotion Examples Marketing
- Marketing Diagrams | Promotion Mix Process Diagram
- Marketing Diagrams | Illustration Diagram For Promotion Mix For ...
- Export Promotion Graph Or Diagram
- Marketing Diagrams | Six Elements Of Promotion Mix Diagram
- Pictures Charts On Promotion