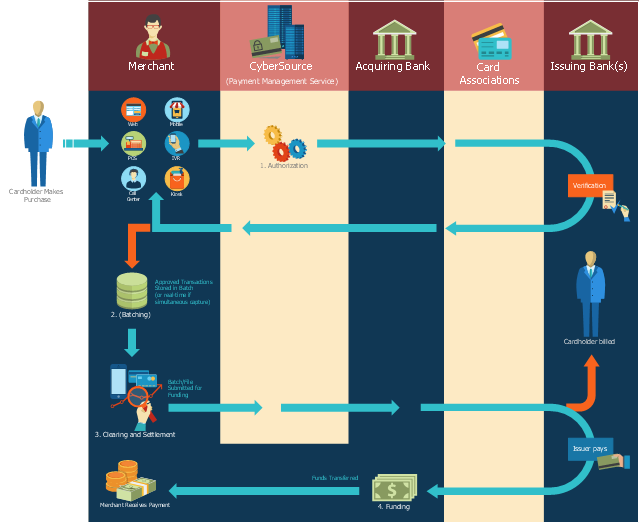
This payment process flowchart example was created on the base of the diagram of payment process using Global Payment Processing Services from the U.S. Securities and Exchange Commission website.
"Global Payment Processing Services. CyberSource Advanced enables merchants to accept payments made by all major credit and debit cards including American Express®, Discover®, Diners Club International®, JCB, MasterCard®, and Visa® cards. Our customers can also accept payment by corporate procurement cards, electronic checks, PayPal® Express Checkout, and the Bill Me Later® service. Merchants that have business models based on subscriptions can utilize the CyberSource recurring billing service with automated account updating services. For merchants selling internationally, we support direct debit, and bank transfers, as well as regional card brands such as Carte Bleue, Carta Si, Dankort, Laser, Solo, and Visa Electron. We provide these services for online, call center, kiosk, integrated voice response (“IVR”), and IP-enabled point of sale (“POS”) transactions."
[www.sec.gov/ Archives/ edgar/ data/ 934280/ 000119312510042764/ d10k.htm]
The flowchart example "Global Payment Solutions" was created using the ConceptDraw PRO diagramming and vector drawing software extended with the Sales Flowcharts solution from the Marketing area of ConceptDraw Solution Park.
Payment process flowchart
Sales Process Management

It is effective to use professional software for the sales process management. ConceptDraw PRO diagramming and vector drawing software extended with Sales Flowcharts solution from the Marketing area of ConceptDraw Solution Park is the best choice.
 Flowcharts
The Flowcharts solution for ConceptDraw PRO is a comprehensive set of examples and samples in several varied color themes for professionals that need to represent graphically a process. Solution value is added by the basic flow chart template and shapes' libraries of flowchart notation. ConceptDraw PRO flow chart creator lets one depict the processes of any complexity and length, as well as design the Flowchart either vertically or horizontally.
Sales Process Flowchart Symbols

Sales Steps

 Sales Flowcharts
The Sales Flowcharts solution lets you create and display sales process maps, sales process workflows, sales steps, the sales process, and anything else involving sales process management.
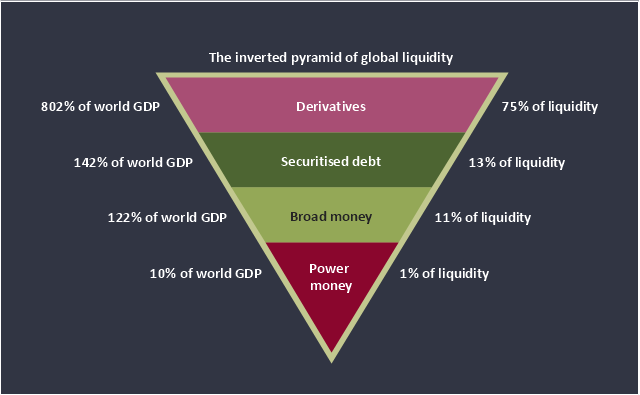
This inverted pyramid diagram of global liquidity shows world GDP and liquidity for 4 levels: derivatives, securitised debt, broad money, and power money.
"In business, economics or investment, market liquidity is a market's ability to facilitate an asset being sold quickly without having to reduce its price very much (or even at all). Equivalently, an asset's market liquidity (or simply "an asset's liquidity") is the asset's ability to sell quickly without having to reduce its price very much. Liquidity is about how big the trade-off is between the speed of the sale and the price it can be sold for. In a liquid market, the trade-off is mild: selling quickly will not reduce the price much. In a relatively illiquid market, selling it quickly will require cutting its price by some amount.
Money, or cash, is the most liquid asset, because it can be "sold" for goods and services instantly with no loss of value. There is no wait for a suitable buyer of the cash. There is no trade-off between speed and value. It can be used immediately to perform economic actions like buying, selling, or paying debt, meeting immediate wants and needs.
If an asset is moderately (or very) liquid, it has moderate (or high) liquidity. In an alternative definition, liquidity can mean the amount of highly liquid assets. If a business has moderate liquidity, it has a moderate amount of very liquid assets. If a business has sufficient liquidity, it has a sufficient amount of very liquid assets and the ability to meet its payment obligations." [Market liquidity. Wikipedia]
This inverted triangle diagram was redesigned using the ConceptDraw PRO diagramming and vector drawing software from Wikimedia Commons file The inverted pyramid of global liquidity.gif. [commons.wikimedia.org/ wiki/ File:The_ inverted_ pyramid_ of_ global_ liquidity.gif]
This triangular chart example is included in the Pyramid Diagrams solution from the Marketing area of ConceptDraw Solution Park.
Inverted pyramid diagram
Pyramid Diagram

Computer Network. Computer and Network Examples


Basic Flowchart Symbols and Meaning


Basic Network Diagram

Approval Process and Segregation of Responsibilities Accounting Flowchart Example

 HR Flowcharts
Human resource management diagrams show recruitment models, the hiring process and human resource development of human resources.
UML Use Case Diagram Example Registration System

- Global Payment Solutions | Cross-Functional Flowchart | SWOT and ...
- Global Payment Solutions | Payment Process Flow Chart Debit Cards
- SWOT Analysis Tool for Small Business | Global Payment Solutions ...
- Global Payment Solutions | UML activity diagram - Payment process ...
- Invoice payment process - Flowchart | Global Payment Solutions ...
- Global Payment Solutions | Why Flowchart Important to Accounting ...
- Sales Process Flowchart. Flowchart Examples | Global Payment ...
- Managing the task list | Global Payment Solutions | UML activity ...
- IVR services | IVR balance recharge | Global Payment Solutions | Ivr ...
- Global Payment Solutions | Flowcharts | Sales Steps | Cybersource ...
- IVR services | IVR mobile - Vector stencils library | Global Payment ...
- IVR services | UML activity diagram - Payment process | Global ...
- Trading process diagram - Deployment flowchart | Global Payment ...
- Basic Flowchart Symbols and Meaning | Sales Process Flowchart ...
- Flow chart Example. Warehouse Flowchart | Invoice payment ...
- Sales Process | Trading process diagram - Deployment flowchart ...
- Interactive Voice Response Network Diagram | Amazon Web ...
- Store reporting flowchart | Interactive Voice Response Diagrams ...
- Process Flowchart | Procurement process mapping | Global ...
- Sales symbols - Vector stencils library | Using Remote Networking ...