This site uses cookies. By continuing to browse the ConceptDraw site you are agreeing to our Use of Site Cookies.

Mathematics Symbols

ConceptDraw PRO extended with Mathematics solution from the Science and Education area is a powerful diagramming and vector drawing software that offers all needed tools for mathematical diagrams designing.
Mathematics solution provides 3 libraries with predesigned vector mathematics symbols and figures:
Solid Geometry Library, Plane Geometry Library and Trigonometric Functions Library.

Scientific Symbols Chart

ConceptDraw PRO is the beautiful design software that provides many vector stencils, examples and templates for drawing different types of illustrations and diagrams.


Mathematics Solution from the Science and Education area of ConceptDraw Solution Park includes a few shape libraries of plane, solid geometric figures, trigonometrical functions and greek letters to help you create different professional looking mathematic illustrations for science and education.

Mechanical Drawing Symbols

ConceptDraw PRO diagramming and vector drawing software extended with Mechanical Engineering solution from the Engineering area of ConceptDraw Solution Park provides a set of drawing tools and predesigned mechanical drawing symbols for fast and easy design various mechanical engineering diagrams, drawings and schematics.

Basic Flowchart Symbols and Meaning

Flowchart Symbols and Meaning - Provides a visual representation of basic flowchart symbols and their proposed use in professional workflow diagram, standard process flow diagram and communicating the structure of a well-developed web site, as well as their correlation in developing on-line instructional projects. See flowchart's symbols by specifics of process flow diagram symbols and workflow diagram symbols.
How to Build a Flowchart

Mathematical Diagrams

ConceptDraw PRO diagramming and vector drawing software extended with Mathematics solution from the Science and Education area is the best for creating: mathematical diagrams, graphics, tape diagrams various mathematical illustrations of any complexity quick and easy.
Mathematics solution provides 3 libraries: Plane Geometry Library, Solid Geometry Library, Trigonometric Functions Library.

ERD Symbols and Meanings

Crow's foot notation is used in Barker's Notation, Structured Systems Analysis and Design Method (SSADM) and information engineering. Crow's foot diagrams represent entities as boxes, and relationships as lines between the boxes. Different shapes at the ends of these lines represent the cardinality of the relationship.
The Chen's ERD notation is still used and is considered to present a more detailed way of representing entities and relationships.
To create an ERD, software engineers mainly turn to dedicated drawing software, which contain the full notation resources for their specific database design - ERD symbols and meanings. CS Odessa has released an all-inclusive Entity-Relationship Diagram (ERD) solution for their powerful drawing program, ConceptDraw PRO.
How to Build an Entity Relationship Diagram (ERD)

Physics Symbols

ConceptDraw PRO diagramming and vector drawing software extended with Physics solution from the Science and Education area is a powerful software for creating various physics diagrams.
Physics solution provides all tools that you can need for physics diagrams designing. It includes 3 libraries with predesigned vector physics symbols: Optics Library, Mechanics Library and Nuclear Physics Library.

Audit Flowchart Symbols

Audit Flowchart helps you draw auditing diagrams for accounting, finance and money management, fiscal information tracking, decision making flow charts, financial inventories and documenting Six Sigma and ISO 9000 business processes.
Audit Flowchart Symbols - It’s efficiently to use the colors creating the audit flowcharts to make them bright, visual, attractive and successful. The best flowchart maker use ConceptDraw PRO features of RapidDraw technique.

Definition Flowchart

A flowchart is a type of diagram that represents an algorithm, workflow or process, showing the steps as boxes of various kinds, and their order by connecting them with arrows.
This definition flowchart gives a clear answer for the question "What is a flowchart?". It is convenient to use a powerful ConceptDraw PRO software extended with Flowcharts Solution from the "Diagrams" Area of ConceptDraw Solution Park to design flowcharts of various types which will additionally illustrate a definition flowchart.

Sales Process Flowchart Symbols

The most easier way of creating the visually engaging and informative Sales Process Flowchart is to create the new ConceptDraw document and to use the predesigned vector symbols offered in 6 libraries of the Sales Flowchart Solution. There are more than six types of sales process flow diagrams, ConceptDraw PRO software is flowchart maker which include six collections of extended flowchart symbols for effective diagramming. There are main collections of color coded flowchart symbols: Sales Department, Sales Steps, Sales Workflow, Sales Symbols and special set of Sales Arrows and Sales Flowchart.

Astronomy Symbols

Are you an astronomer, astronomy teacher or student? And you need to draw astronomy pictures quick and easy? ConceptDraw PRO diagramming and vector drawing software extended with Astronomy solution from the Science and Education area will help you!
Astronomy solution provides 7 libraries with wide variety of predesigned vector objects of astronomy symbols, celestial bodies, solar system symbols, constellations, etc.

Hotel Network Topology Diagram

Hotel Network Topology Diagram - The Computer and Networks solution from Computer and Networks area of ConceptDraw Solution Park provides examples, templates and vector stencils library with symbols of local area network (LAN) and wireless LAN (WLAN) equipment.
Use it to draw the physical and logical network topology diagrams for wired and wireless computer communication networks.
Create Network Topology Diagram
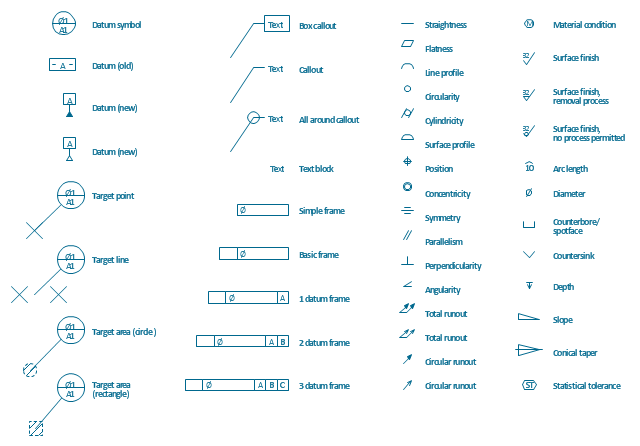
The vector stencils library "Dimensioning and tolerancing" contains 45 symbols of geometric dimensions and mechanical tolerances, geometric symbols, callouts, and text boxes and inserts.
Use these geometric dimensioning and tolerancing (GD&T) shapes to create annotated mechanical drawings.
"Geometric dimensioning and tolerancing (GD&T) is a system for defining and communicating engineering tolerances. It uses a symbolic language on engineering drawings and computer-generated three-dimensional solid models that explicitly describes nominal geometry and its allowable variation. It tells the manufacturing staff and machines what degree of accuracy and precision is needed on each controlled feature of the part. GD&T is used to define the nominal (theoretically perfect) geometry of parts and assemblies, to define the allowable variation in form and possible size of individual features, and to define the allowable variation between features." [Geometric dimensioning and tolerancing. Wikipedia]
The shapes example "Design elements - Dimensioning and tolerancing" was created using the ConceptDraw PRO diagramming and vector drawing software extended with the Mechanical Engineering solution from the ConceptDraw Solution Park.
Dimensioning and tolerancing symbols
Dimensioning and tolerancing symbols, total runout, text block, symmetry, surface, finish, roughness, surface profile, straightness, statistical tolerance, slope, position, positioning, perpendicularity, parallelism, material condition, line profile, flatness, diameter, depth, datum, reference, circle, datum, feature control, datum target, point, datum target, line, datum target, area, datum, cylindricity, countersink, counterbore, spotface, conical taper, concentricity, circularity, circular runout, callout, arc length, angularity,

Cisco Network Topology. Cisco icons, shapes, stencils and symbols

The Cisco Network Diagrams solution uses Cisco network symbols and Cisco icons to visualize computer networks. Cisco Network Topology is the arrangement of the Cisco symbols that display scheme of computer network.
Any Cisco equipment on the network are named like node. Network diagram topology commonly designed within connected nodes. Cisco icons are worldwide acknowledged and mainly established as standard icons for network diagrams. You may use them loosely, but you may not rework them.
The Cisco Network Diagram shows how signals act on the networked devices, or how data routes on the network from one device to the other. There are number of physical network typologies that engineers use while constructing computer networks.