This site uses cookies. By continuing to browse the ConceptDraw site you are agreeing to our Use of Site Cookies.

Data Flow Diagram

Data flow diagram (DFD) is the part of the SSADM method (Structured Systems Analysis and Design Methodology), intended for analysis and information systems projection. Data flow diagrams are intended for graphical representation of data flows in the information system and for analysis of data processing during the structural projection. Data flow diagram often used in connection with human process and can be displayed as workflow diagram. The critical Process Flow Diagram is another flowchart technique for designing data flow in connection with organizational processes. The critical Process flow diagram may use different range of symbols than a classic workflow diagram.

DFD Flowchart Symbols

A Data Flow Diagram (DFD) is a graphical technique which allows effectively model and analyze the information processes and systems. The ability to fast and easy create the DFDs is made possible with Data Flow Diagrams solution from the Software Development area of ConceptDraw Solution Park. For designing the Data Flow Diagrams are used simple DFD flowchart symbols which are connected each other by arrows depicting the data flow from one step to another.

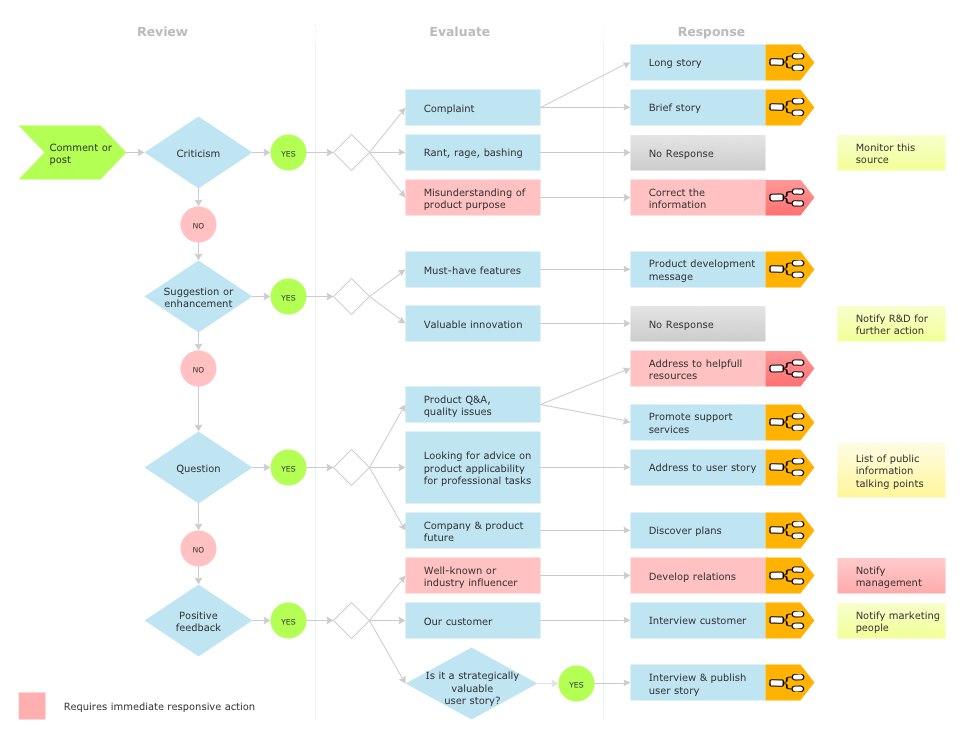
Social Media Response DFD Flowcharts - diagramming software ( Mac PC )

Diagramming software for Mac and PC - create flowcharts and presentations for Social Media Organizing.

Data Flow Diagram Model

The DFD (Yourdon and Coad notation) example "Model of small traditional production enterprise" below was created using the ConceptDraw DIAGRAM diagramming and vector drawing software extended with the Data Flow Diagrams solution from the Software Development area of ConceptDraw Solution Park.

Data Flow Diagram Symbols. DFD Library

Data Flow Diagrams show information transfers and process steps of a system. The general concept is an approach of a depicting how occurs input in a system, further processes and what runs out. The aim of DFD is in accomplishing of understanding between developers and users. Data flow diagrams are maintained with other methods of structured systems analysis.

Taxi Service Data Flow Diagram DFD Example

This sample shows the Data Flow Diagram of the Taxi Service and interactions between the Clients, Operators and Divers, as well as Orders and Reports databases.

How to Connect Social Media DFD Flowchart with Action Maps

The Social Media Response solution creates interactive social media flow charts and action mind maps. The solution includes a video tutorial and a number of samples helping social media teams refine and organize their response process.

How to Create a Social Media DFD Flowchart

Interactive tool helps you create a social media DFD flowchart to find the appropriate response to social media mentions quickly.
It allows companies to be more effective in timely messaging thanks to the ability for rapid response to a customer′s post in social media. This saves budget for companies who use social media for promoting and as a lead generation tool.

Examples Flowchart

ConceptDraw DIAGRAM diagramming and vector drawing software provides the unique Flowcharts Solution from the "Diagrams" Area of ConceptDraw Solution Park with variety of vector objects libraries and collection of examples Flowchart. Each example flowchart included in Flowcharts solution is a real help in drawing process, it can be the good base or perfect source of inspiration.

Data Flow Diagrams

ConceptDraw DIAGRAM software enables you to quickly create data flow diagrams that include data storage, external entities, functional transforms, data flows, and control transforms and signals.