Pyramid Chart Examples

How To Create a Flow Chart in ConceptDraw

Infographic Maker

Geo Map — Australia — New Zealand

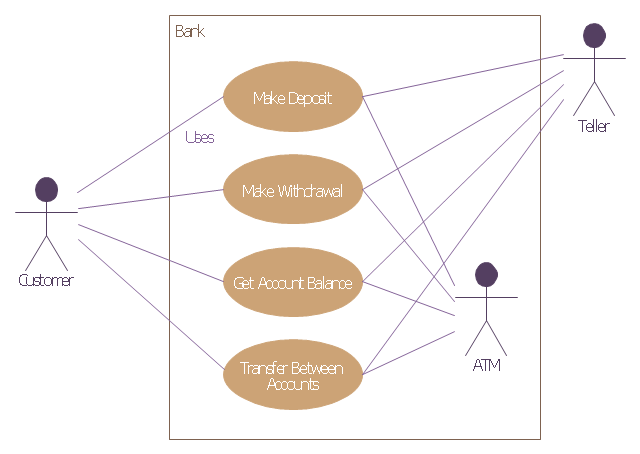
This example of bank ATM UML activity diagram was created on the base of UML use case diagram of automated teller machine from the course "Thinking in Java, 2nd edition, Revision 9" by Bruce Eckel published on the website of the Computer Science and Electrical Engineering Department of the University of Maryland, Baltimore (UMBC).
"If you are designing an auto-teller, for example, the use case for a particular aspect of the functionality of the system is able to describe what the auto-teller does in every possible situation. Each of these “situations” is referred to as a scenario, and a use case can be considered a collection of scenarios. You can think of a scenario as a question that starts with: “What does the system do if...?” For example, “What does the auto-teller do if a customer has just deposited a check within the last 24 hours, and there’s not enough in the account without the check having cleared to provide a desired withdrawal?”
Use case diagrams are intentionally simple to prevent you from getting bogged down in system implementation details prematurely...
Each stick person represents an “actor,” which is typically a human or some other kind of free agent. (These can even be other computer systems, as is the case with “ATM.”) The box represents the boundary of your system. The ellipses represent the use cases, which are descriptions of valuable work that can be performed with the system. The lines between the actors and the use cases represent the interactions.
It doesn’t matter how the system is actually implemented, as long as it looks like this to the user."
[csee.umbc.edu/ courses/ 331/ resources/ tij/ text/ TIJ213.gif]
This automated teller machine (ATM) UML use case diagram example was created using the ConceptDraw PRO diagramming and vector drawing software extended with the ATM UML Diagrams solution from the Software Development area of ConceptDraw Solution Park.
Bank ATM UML sequence diagram
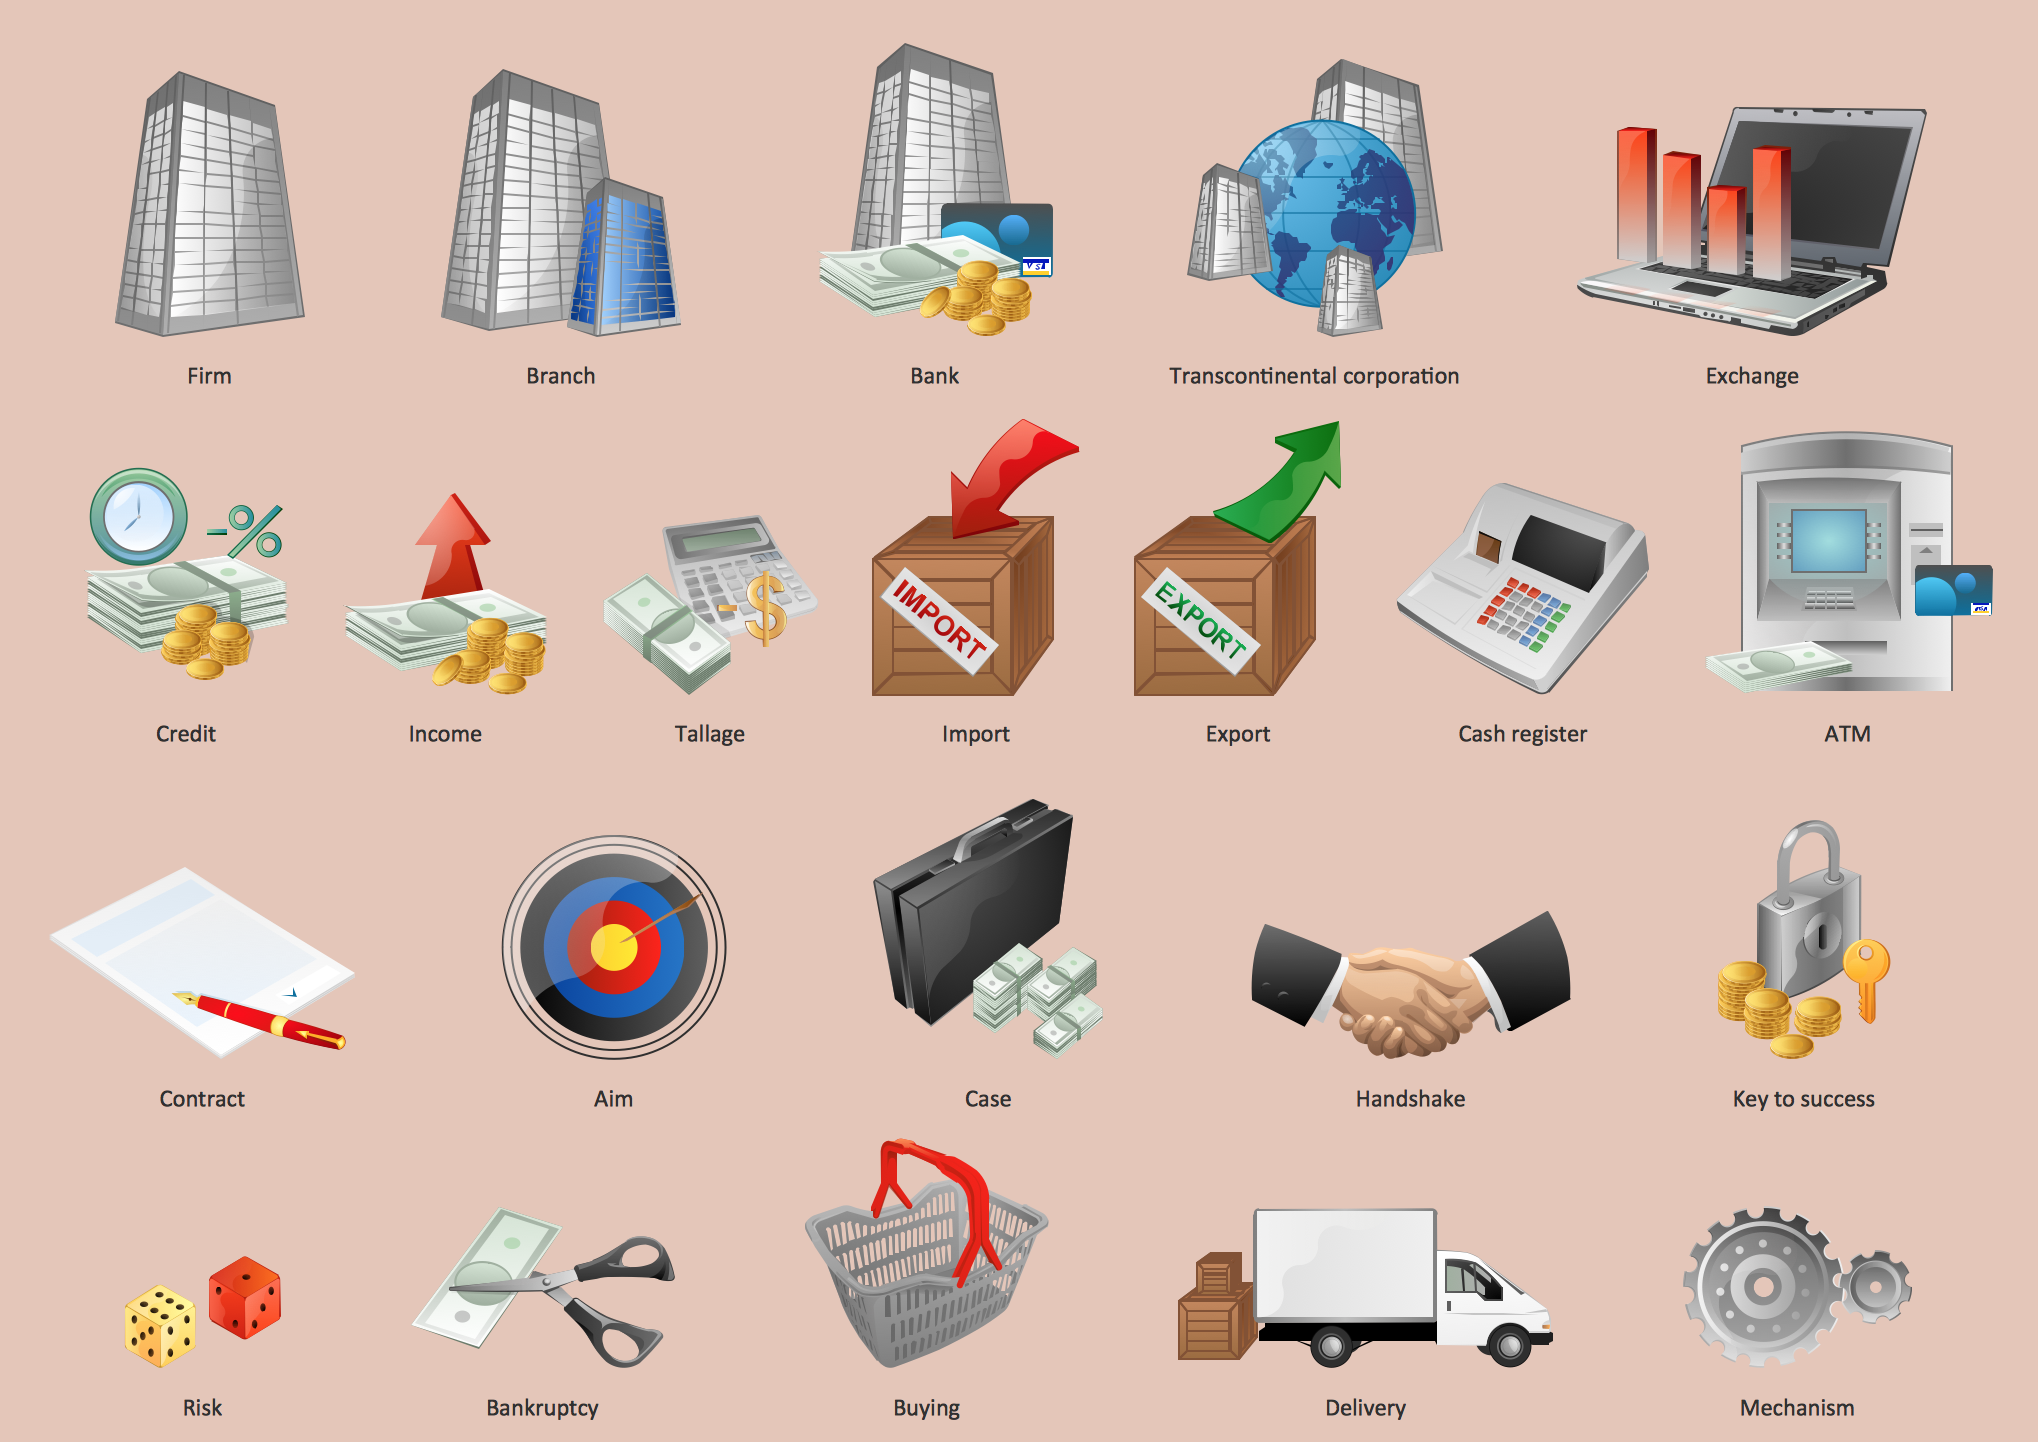
 Aerospace and Transport
This solution extends ConceptDraw DIAGRAM software with templates, samples and library of vector clipart for drawing the Aerospace and Transport Illustrations. It contains clipart of aerospace objects and transportation vehicles, office buildings and anci
Business - Design Elements
The vector stencils library "ABC" contains 87 symbols of English letters, numerals and punctuation marks.
"An alphabet is a standard set of letters (basic written symbols or graphemes) which is used to write one or more languages based on the general principle that the letters represent phonemes (basic significant sounds) of the spoken language. This is in contrast to other types of writing systems, such as syllabaries (in which each character represents a syllable) and logographies (in which each character represents a word, morpheme, or semantic unit). ... There are dozens of alphabets in use today, the most popular being the Latin alphabet (which was derived from the Greek). Many languages use modified forms of the Latin alphabet, with additional letters formed using diacritical marks. ... Alphabets are usually associated with a standard ordering of their letters. This makes them useful for purposes of collation, specifically by allowing words to be sorted in alphabetical order. It also means that their letters can be used as an alternative method of "numbering" ordered items, in such contexts as numbered lists." [Alphabet. Wikipedia]
The vector typography example "ABC - Vector stencils library" was created using the ConceptDraw PRO diagramming and vector drawing software extended with the Artwork solution from the Illustration area of ConceptDraw Solution Park.


 ATM UML Diagrams
The ATM UML Diagrams solution lets you create ATM solutions and UML examples. Use ConceptDraw DIAGRAM as a UML diagram creator to visualize a banking system.
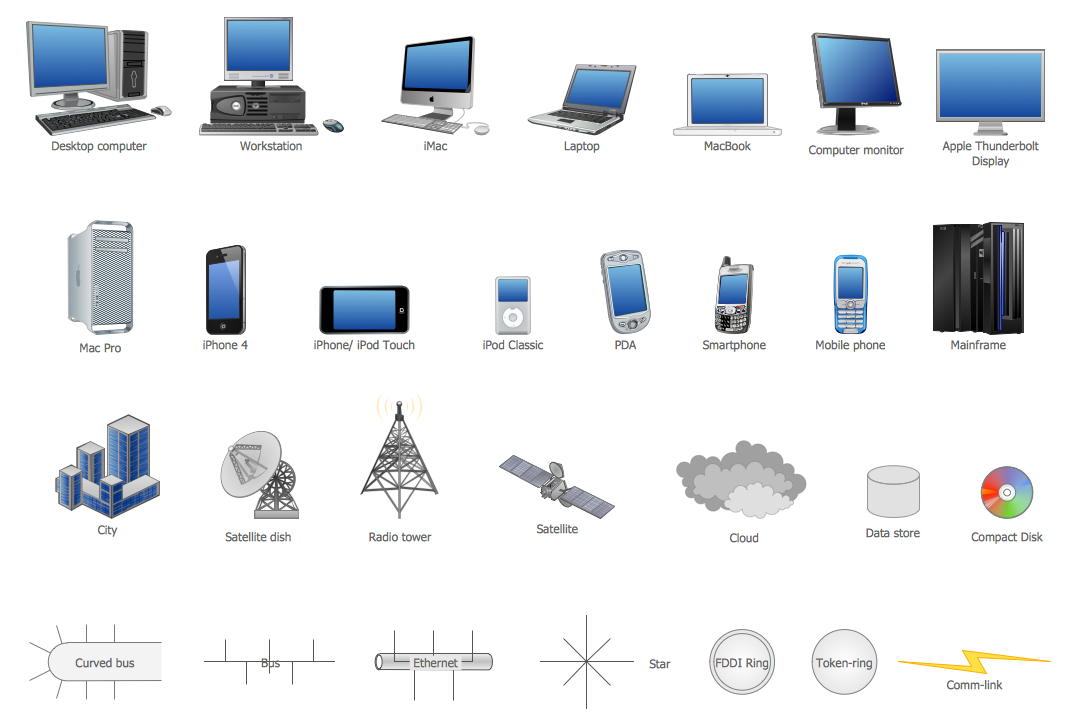
Network Icon
Design Pictorial Infographics. Design Infographics

Feature Comparison Chart Software

Business Process Workflow Diagram


Scrum process work items and workflow

- 24 Hour Clock Vector Free
- Hours Vector
- 24 Hours Icon Illustration Png
- Last 24 Hours Vector
- Time and clock pictograms - Vector stencils library | Time and clock ...
- Time 24 Hrs Icon
- Png In 24 Hours
- Design elements - Time and clock pictograms | Time and clock ...
- Northern constellations (45-90 degrees) - Vector stencils library ...
- 24 Hours Png
- Pyramid Diagram | Time - Vector stencils library | Time and clock ...
- Time and clock pictograms - Vector stencils library | Design ...
- Time - Design Elements | Time and clock pictograms - Vector ...
- Time and clock pictograms - Vector stencils library | Design ...
- Time - Design Elements | Time and clock pictograms - Vector ...
- Wireframe Examples | Bio Flowchart Lite | Time and clock ...
- Time and clock pictograms - Vector stencils library | Design Pictorial ...
- Pyramid Diagram | Time - Design Elements | Time - Vector stencils ...
- Design Pictorial Infographics. Design Infographics | Time and clock ...
- Time and clock pictograms - Vector stencils library | Time - Vector ...