Technical Flow Chart

Example of DFD for Online Store (Data Flow Diagram) DFD Example


Flow Chart Online

 Flowcharts
The Flowcharts solution for ConceptDraw PRO is a comprehensive set of examples and samples in several varied color themes for professionals that need to represent graphically a process. Solution value is added by the basic flow chart template and shapes' libraries of flowchart notation. ConceptDraw PRO flow chart creator lets one depict the processes of any complexity and length, as well as design the Flowchart either vertically or horizontally.
Flow chart Example. Warehouse Flowchart


Data Flow Diagram Model

 ConceptDraw Solution Park
ConceptDraw Solution Park collects graphic extensions, examples and learning materials
Entity Relationship Diagram - ERD - Software for Design Crows Foot ER Diagrams
_Win_Mac.png "Entity Relationship Diagram Software, Design Elements - Crows Foot (Windows, Macintosh)")

 Telecommunication Network Diagrams
Telecommunication Network Diagrams solution extends ConceptDraw PRO software with samples, templates, and great collection of vector stencils to help the specialists in a field of networks and telecommunications, as well as other users to create Computer systems networking and Telecommunication network diagrams for various fields, to organize the work of call centers, to design the GPRS networks and GPS navigational systems, mobile, satellite and hybrid communication networks, to construct the mobile TV networks and wireless broadband networks.
Taxi Service Data Flow Diagram DFD Example

 Event-driven Process Chain Diagrams
Event-driven Process Chain (EPC) Diagram is a type of flowchart widely used for modeling in business engineering and reengineering, business process improvement, and analysis. EPC method was developed within the Architecture of Integrated Information Systems (ARIS) framework.
 AWS Architecture Diagrams
AWS Architecture Diagrams with powerful drawing tools and numerous predesigned Amazon icons and AWS simple icons is the best for creation the AWS Architecture Diagrams, describing the use of Amazon Web Services or Amazon Cloud Services, their application for development and implementation the systems running on the AWS infrastructure. The multifarious samples give you the good understanding of AWS platform, its structure, services, resources and features, wide opportunities, advantages and benefits from their use; solution’s templates are essential and helpful when designing, description and implementing the AWS infrastructure-based systems. Use them in technical documentation, advertising and marketing materials, in specifications, presentation slides, whitepapers, datasheets, posters, etc.
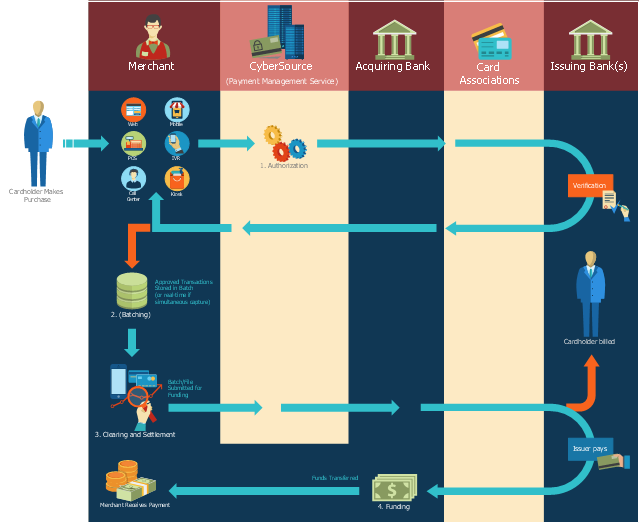
This payment process flowchart example was created on the base of the diagram of payment process using Global Payment Processing Services from the U.S. Securities and Exchange Commission website.
"Global Payment Processing Services. CyberSource Advanced enables merchants to accept payments made by all major credit and debit cards including American Express®, Discover®, Diners Club International®, JCB, MasterCard®, and Visa® cards. Our customers can also accept payment by corporate procurement cards, electronic checks, PayPal® Express Checkout, and the Bill Me Later® service. Merchants that have business models based on subscriptions can utilize the CyberSource recurring billing service with automated account updating services. For merchants selling internationally, we support direct debit, and bank transfers, as well as regional card brands such as Carte Bleue, Carta Si, Dankort, Laser, Solo, and Visa Electron. We provide these services for online, call center, kiosk, integrated voice response (“IVR”), and IP-enabled point of sale (“POS”) transactions."
[www.sec.gov/ Archives/ edgar/ data/ 934280/ 000119312510042764/ d10k.htm]
The flowchart example "Global Payment Solutions" was created using the ConceptDraw PRO diagramming and vector drawing software extended with the Sales Flowcharts solution from the Marketing area of ConceptDraw Solution Park.
Payment process flowchart
Flowchart Software


- Flowchart For Online Mobile Store
- Mobile Bill Flow Chart
- Online store social media response flowchart | Example of DFD for ...
- Online Flow Chart | Flow Chart Online | Cross-Functional Flowcharts ...
- Dfd Daigram Of Online Mobile Buying Selling System
- Cross-Functional Flowchart | Example of DFD for Online Store (Data ...
- Online Flow Chart | Example of DFD for Online Store (Data Flow ...
- Mobile Banking Flow Chart Steps
- How To Draw Flowchart For Online Shopping Site
- Buying A Product Online Flowchart
- Flow chart Example. Warehouse Flowchart | Online store social ...
- Online store social media response flowchart | Example of DFD for ...
- System Flow Chart From Online Shoping
- Types of Flowcharts | Online store social media response flowchart ...
- Process Flowchart | Online Collaboration via Skype | Sales Process ...
- Top 5 Android Flow Chart Apps | Technical Flow Chart | DroidDia ...
- Online Shopping Flow Chart
- Online Flow Chart | Flow Chart Online | Accounting Flowcharts ...
- Online shop - Concept map | Contoh Flowchart | How to Create a ...
- Marketing Diagrams | Marketing Analysis Diagram | Flowchart ...