Sales Process FlowchartFlowchart Examples

 Cross-Functional Flowcharts
The Cross-Functional Flowcharts solution extends ConceptDraw DIAGRAM software with cross functional flowchart examples, samples, and libraries of cross functional flow chart vector design elements and CH-1 symbols for easy drawing professional-looking and illustrative Cross Functional Flowchart, Cross Functional Diagram, CH-1 Diagram, Process Flowchart, Deployment Flowchart, Opportunity Flowchart, Swimlane Process Mapping Diagram, or Visio Cross Functional Flowchart for planning and further analyzing, optimizing and improvement processes. The use of included pre-made cross functional flowchart template, opportunity flowchart template, and swimlane process map template, greatly easier designing your Cross-functional flowcharts.
Work Order Process Flowchart. Business Process Mapping Examples

Accounting Flowchart

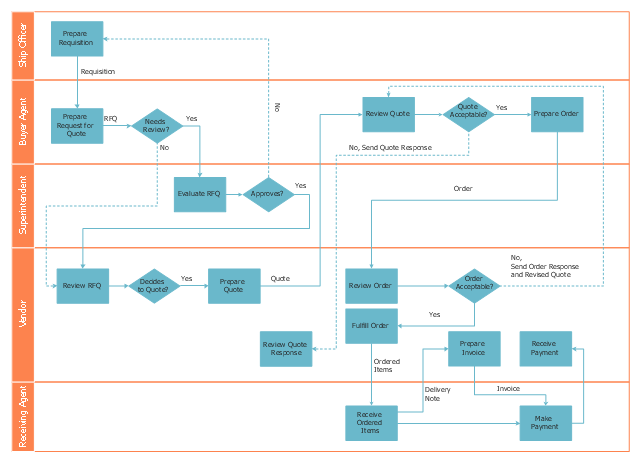
This deployment flow chart sample shows the trading process flow.
"Trade, also called goods exchange economy, is to transfer the ownership of goods from one person or entity to another by getting something in exchange from the buyer. Trade is sometimes loosely called commerce or financial transaction or barter. A network that allows trade is called a market. ...
Modern traders ... generally negotiate through a medium of exchange, such as money. As a result, buying can be separated from selling, or earning. ...
Retail trade consists of the sale of goods or merchandise from a very fixed location, such as a department store, boutique or kiosk, or by mail, in small or individual lots for direct consumption by the purchaser. Wholesale trade is defined as the sale of goods that are sold merchandise to retailers, to industrial, commercial, institutional, or other professional business users, or to other wholesalers and related subordinated services." [Trade. Wikipedia]
The swim lane diagram example "Deployment flowchart - Trading process diagram" was created using the ConceptDraw PRO diagramming and vector drawing software extended with the Cross-Functional Flowcharts solution from the Business Processes area of ConceptDraw Solution Park.
Swim lane diagram
Basic Audit Flowchart. Flowchart Examples

Work Process

Workflow Diagram Template

Money - Design Elements

Pyramid Diagram

Optimize a Workflow

How to Design a Good Workflow

Bar Chart Examples

Business and Finance Illustrations

EPC Diagrams Illustrate Business Process Work Flows

How to Draw an Effective Workflow

Business Process Optimization

- Block Diagrams | Sales Dashboard | System Flowchart Diagram ...
- How to Make a Workflow Diagram Using ConceptDraw PRO | Sales ...
- Business Process Model and Notation | How to Make a Workflow ...
- Process Flowchart | Product life cycle process - Flowchart | Sales ...
- Business Intelligence Dashboard | Area Charts | Pie Charts ...
- Process Flowchart - Flowchart | Revenue Cycle Flow Chart
- Sales Process Flowchart . Flowchart Examples | Process Flowchart ...
- Revenue Cycle Management Flow Chart
- Sales Growth. Bar Graphs Example | Revenue and Employment ...
- Program Flow Chart Of Revenue Cycle