Graphical User Interface Examples

How to Create a Social Media DFD Flowchart

Android GUI

 Accounting Flowcharts
Accounting Flowcharts solution extends ConceptDraw DIAGRAM software with templates, samples and library of vector stencils for drawing the accounting flow charts.
Rack Diagrams


 Sales Flowcharts
The Sales Flowcharts solution lets you create and display sales process maps, sales process workflows, sales steps, the sales process, and anything else involving sales process management.
 Flowcharts
The Flowcharts solution for ConceptDraw DIAGRAM is a comprehensive set of examples and samples in several varied color themes for professionals that need to represent graphically a process. Solution value is added by the basic flow chart template and shapes' libraries of flowchart notation. ConceptDraw DIAGRAM flow chart creator lets one depict the processes of any complexity and length, as well as design the Flowchart either vertically or horizontally.
 Audit Flowcharts
Audit flowcharts solution extends ConceptDraw DIAGRAM software with templates, samples and library of vector stencils for drawing the audit and fiscal flow charts.
 Cross-Functional Flowcharts
Cross-functional flowcharts are powerful and useful tool for visualizing and analyzing complex business processes which requires involvement of multiple people, teams or even departments. They let clearly represent a sequence of the process steps, the order of operations, relationships between processes and responsible functional units (such as departments or positions).
 HR Flowcharts
Human resource management diagrams show recruitment models, the hiring process and human resource development of human resources.
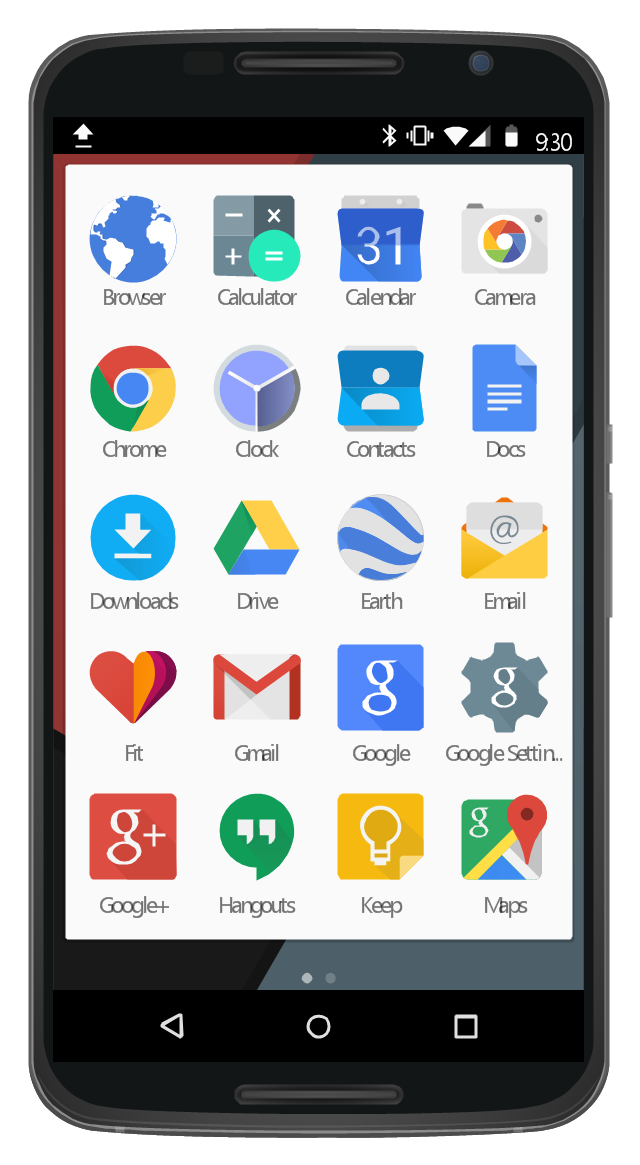
This UI design example shows common icons of Android applications on the App Drawer screen of Google Nexus 6 smartphone.
The user interface design example "Android 5.0 - App drawer" was created using the ConceptDraw PRO diagramming and vector drawing software extended with the "Android user interface" solution from the "Software Development" area of ConceptDraw Solution Park.
The user interface design example "Android 5.0 - App drawer" was created using the ConceptDraw PRO diagramming and vector drawing software extended with the "Android user interface" solution from the "Software Development" area of ConceptDraw Solution Park.
App Drawer UI
 Logistics Flow Charts
Logistics Flow Charts solution extends ConceptDraw DIAGRAM functionality with opportunities of powerful logistics management software. It provides large collection of predesigned vector logistic symbols, pictograms, objects and clipart to help you design with pleasure Logistics flow chart, Logistics process flow diagram, Inventory flow chart, Warehouse flowchart, Warehouse management flow chart, Inventory control flowchart, or any other Logistics diagram. Use this solution for logistics planning, to reflect logistics activities and processes of an enterprise or firm, to depict the company's supply chains, to demonstrate the ways of enhancing the economic stability on the market, to realize logistics reforms and effective products' promotion.
GUI Software

 Social Media Response
This solution extends ConceptDraw DIAGRAM and ConceptDraw MINDMAP with the ability to draw interactive flow charts with action mind map templates, to help create an effective response to applicable social media mentions.
 Jackson Structured Programming (JSP) Diagrams
The Jackson Structured Programming (JSP) Diagram solution extends the functionality and drawing abilities of the ConceptDraw DIAGRAM software with set of illustrative JSP diagrams samples and large variety of predesigned vector objects of actions, processes, procedures, selection, iteration, as well as arrows and connectors to join the objects during Jackson structured development and designing Jackson structured programming diagrams, JSP diagram, Jackson structure diagram (JSD), Program structure diagram. The powerful abilities of this solution make the ConceptDraw DIAGRAM ideal assistant for programmers, software developers, structural programmers, computer engineers, applications constructors, designers, specialists in structured programming and Jackson systems design, and other technical, computer and software specialists.
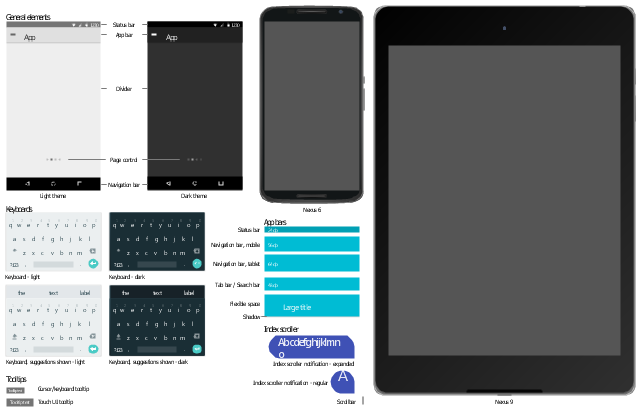
The vector stencils library "Android UI" contains 28 UI elements: screen, status bar, app bar, divider, navigation bar, page control, tab, search bar, flexible space, keyboard, cursor tooltip, touch UI tooltip, index scroller, Google Nexus 6 smartphone, Google Nexus 9 tablet.
Use it to design user interface of your Android 5 application.
The shapes example "Design elements - Android UI" was created using the ConceptDraw PRO diagramming and vector drawing software extended with the "Android user interface" solution from the "Software Development" area of ConceptDraw Solution Park.
User interface elements
The vector stencils library "Flowchart" contains 26 symbols for drawing the flow charts using the ConceptDraw PRO diagramming and vector drawing software.
"Flowcharts are used in designing and documenting complex processes or programs. Like other types of diagrams, they help visualize what is going on and thereby help the viewer to understand a process, and perhaps also find flaws, bottlenecks, and other less-obvious features within it. There are many different types of flowcharts, and each type has its own repertoire of boxes and notational conventions. The two most common types of boxes in a flowchart are:
(1) a processing step, usually called activity, and denoted as a rectangular box;
(2) a decision, usually denoted as a diamond.
A flowchart is described as "cross-functional" when the page is divided into different swimlanes describing the control of different organizational units. A symbol appearing in a particular "lane" is within the control of that organizational unit. This technique allows the author to locate the responsibility for performing an action or making a decision correctly, showing the responsibility of each organizational unit for different parts of a single process. ...
Common alternate names include: flowchart, process flowchart, functional flowchart, process map, process chart, functional process chart, business process model, process model, process flow diagram, work flow diagram, business flow diagram. The terms "flowchart" and "flow chart" are used interchangeably." [Flowchart. Wikipedia]
The example "Design elements - Flowchart" is included in the Flowcharts solution from the area "What is a Diagram" of ConceptDraw Solution Park.
Flowchart notation

 Plan-Do-Check-Act (PDCA)
Plan-Do-Check-Act (PDCA) solution extends the ConceptDraw DIAGRAM software with collection of samples and predesigned vector objects for easy visualization four stages of PDCA cycle, PDSA cycle, or Deming cycle, for illustration effective application of this method to the practical business tasks, for depiction the implementation of changes and solution the problems in business processes. Plan-Do-Check-Act (PDCA) solution helps to design professional-looking and attractive Plan Do Study Act diagrams, PDCA cycle diagrams, PDCA Process diagrams, and to construct the Quality Management Process Models, which all assist to manage efficiently the business processes, to improve quality of work and to reduce significantly the costs.
 Seven Basic Tools of Quality
Manage quality control in the workplace, using fishbone diagrams, flowcharts, Pareto charts and histograms, provided by the Seven Basic Tools of Quality solution.
- | | Android App Development Flow Chart
- Top 5 Android Flow Chart Apps | Bio Flowchart | Process Mapping App
- Mobile App Development Process Flowchart
- Er Diagram Of Any Android Application Project
- Flow Chart On Android App Development
- Data Flow Diagram Examples For Android Application
- Tree Chart Maker App For Android
- | How to Design an Interface Mock-up of an Android Application ...
- Entity Relationship Diagram Examples | | Database Flowchart ...
- | Pie Chart Software | | Flowchart Android App Download
- Android Application Flowchart
- Sample Mobile App Flowchart
- | Good Flow Chart app for Mac | Android User Interface | Tree ...
- Organizational Chart Android
- Flow Chart Of A Music Player Android App
- | | | Android App Development Flow Diagram
- Business Processes | Process Flowchart | How to Design an ...
- Top 5 Android Flow Chart Apps | Time picker dialog | Cloud clipart ...
- Data Flow Diagrams (DFD) | | Android User Interface | Dfd For ...
- Data Flow Diagrams (DFD) | | How To Make Data Flow Diagram In ...