Property Management Examples

This flowchart example was created on the base of land sales process diagram from the Property management webpage of the VicRoads website.
[www.vicroads.vic.gov.au/ planning-and-projects/ property-services/ property-management]
"VicRoads or the Roads Corporation of Victoria is a statutory corporation which is the state road and traffic authority in the state of Victoria, Australia. It is responsible for maintenance and construction of the state arterial road network, as well as driver licensing and vehicle registration. VicRoads has broad responsibility for road safety policy and research. It is also responsible for regulating the accident towing industry in Victoria." [VicRoads. Wikipedia]
"Sales Process.
Once it has been established with the relevant VicRoads Regions/ Projects and other business areas that properties are identified as surplus to VicRoads’ operational needs, they are incorporated in the VicRoads annual sales program.
Following approval: relevant VicRoads Regional Manager and the VicRoads Chief Executive (and in some circumstances Minster for Public Transport and Roads) must approve all land deemed surplus and available for disposal.
The method of sale is then determined and consultant advice is sought:
(1) Planning.
(2) Valuer General Victoria (Valuer General’s office must provide a valuation for all sales).
(3) Government Land Monitor (Land Monitor approval is sought if the value exceeds $750,000).
(4) Environmental.
(5) Local Council." [www.vicroads.vic.gov.au/ planning-and-projects/ property-services/ property-management]
The example "Land sales process flowchart" was created using the ConceptDraw PRO diagramming and vector drawing software extended with the Sales Flowcharts solution from the Marketing area of ConceptDraw Solution Park.
Sales process chart

Business Board Org Chart

UML Class Diagram Example - Apartment Plan

Work Order Process Flowchart. Business Process Mapping Examples

Types of Flowcharts


Bubble diagrams with ConceptDraw DIAGRAM

Network Visualization with ConceptDraw DIAGRAM

Sales Process Flowchart. Flowchart Examples

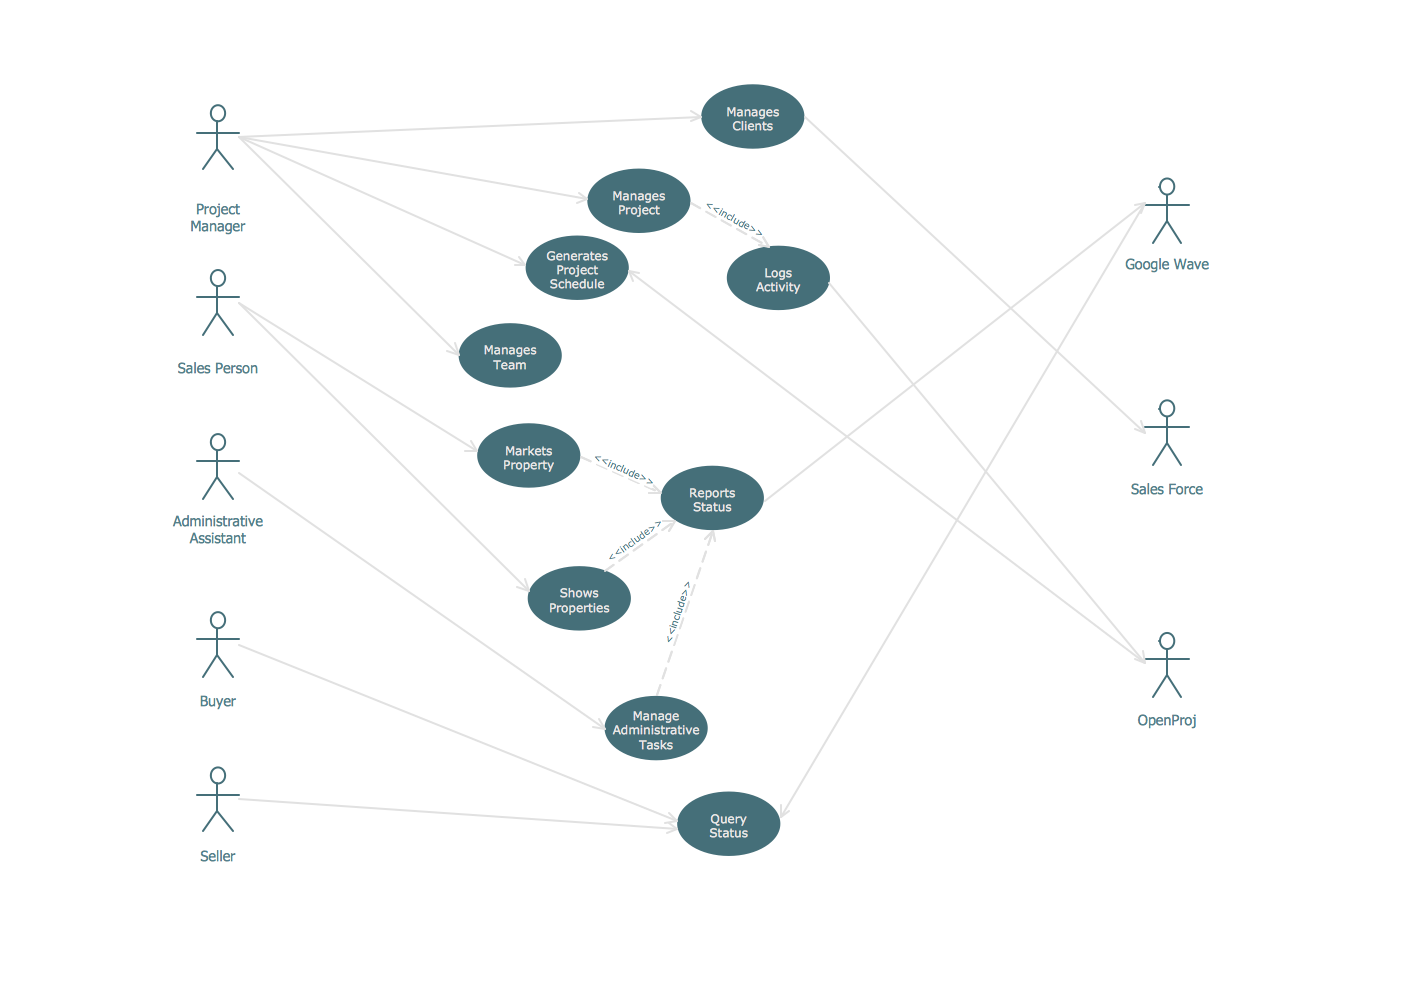
UML Use Case Diagram Example - Estate Agency
- Data Flow Diagram Of Property Management System
- Property Management Examples | Work Order Process Flowchart ...
- Land sales process flowchart | Flow Chart Of Property Management ...
- Property Management Examples | UML Class Diagram Example ...
- Rapid UML | Data Flow Diagram For Real Estate Management System
- Data Flow Diagram For Apartment Management System
- Property Management Structure Diagram
- Data Flow Diagrams For Real Estate Management
- Dataflow Diagram Of Apartment Management System
- Property Management System Flowchart