Chemical Engineering
ConceptDraw PRO is a powerful diagramming and vector drawing software. Extended with Chemical and Process Engineering Solution from the Industrial Engineering Area of ConceptDraw Solution Park, it became the best Chemical Engineering software.Process Flowchart
The main reason of using Process Flowchart or PFD is to show relations between major parts of the system. Process Flowcharts are used in process engineering and chemical industry where there is a requirement of depicting relationships between major components only and not include minor parts. Process Flowcharts for single unit or multiple units differ in their structure and implementation. ConceptDraw PRO is Professional business process mapping software for making Process flowcharts, Process flow diagram, Workflow diagram, flowcharts and technical illustrations for business documents and also comprehensive visio for mac application. Easier define and document basic work and data flows, financial, production and quality management processes to increase efficiency of your business with ConcepDraw PRO. Business process mapping software with Flowchart Maker ConceptDraw PRO includes extensive drawing tools, rich examples and templates, process flowchart symbols and shape libraries, smart connectors that allow you create the flowcharts of complex processes, process flow diagrams, procedures and information exchange. Process Flowchart Solution is project management workflow tools which is part ConceptDraw Project marketing project management software. Drawing charts, diagrams, and network layouts has long been the monopoly of Microsoft Visio, making Mac users to struggle when needing such visio alternative like visio for mac, it requires only to view features, make a minor edit to, or print a diagram or chart. Thankfully to MS Visio alternative like ConceptDraw PRO software, this is cross-platform charting and business process management tool, now visio alternative for making sort of visio diagram is not a problem anymore however many people still name it business process visio tools.
 Logistics Flow Charts
Logistics Flow Charts solution extends ConceptDraw PRO v11 functionality with opportunities of powerful logistics management software. It provides large collection of predesigned vector logistic symbols, pictograms, objects and clipart to help you design with pleasure Logistics flow chart, Logistics process flow diagram, Inventory flow chart, Warehouse flowchart, Warehouse management flow chart, Inventory control flowchart, or any other Logistics diagram. Use this solution for logistics planning, to reflect logistics activities and processes of an enterprise or firm, to depict the company's supply chains, to demonstrate the ways of enhancing the economic stability on the market, to realize logistics reforms and effective products' promotion.
Copying Service Process Flowchart. Flowchart Examples
This sample was created in ConceptDraw PRO diagramming and vector drawing software using the Flowcharts solution from the Diagrams area of ConceptDraw Solution Park. This sample shows the Flowchart on that it is displayed the process of the determination the permissibility according the Access Copyright license. The diamonds represent the decision points. Inside the diamonds are the questions that need the answer yes/no. It is necessary to answer on the question, make the decision that will determine the next step.Kanban Board Software
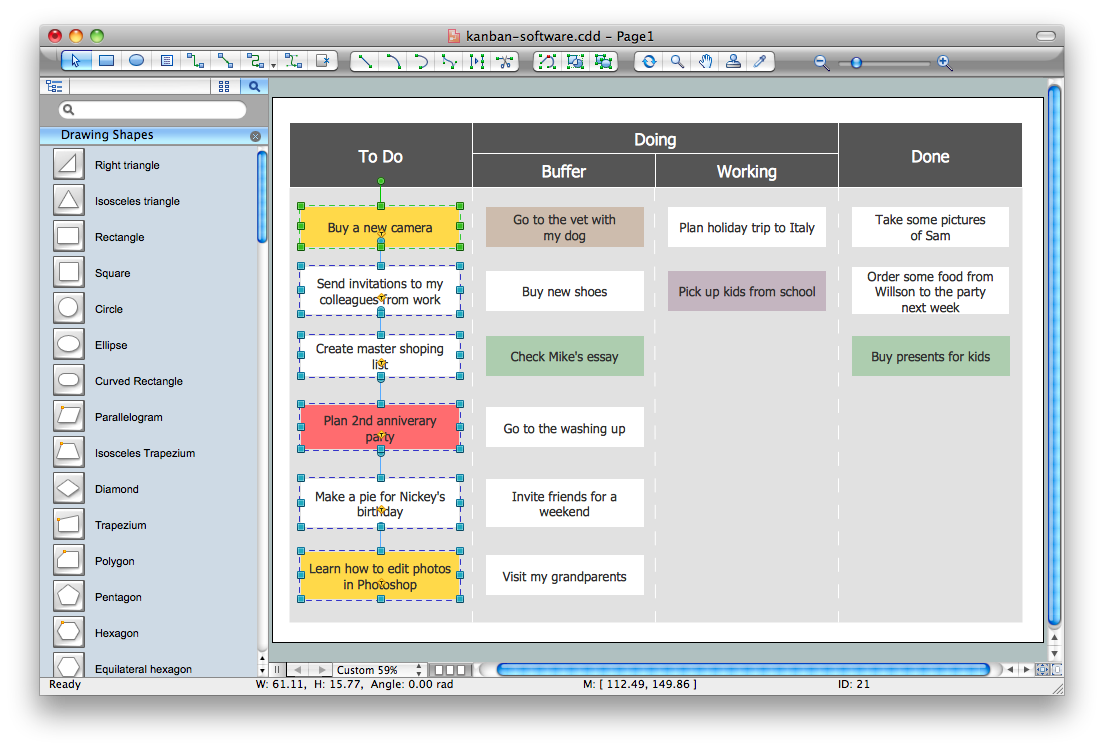
Kanban Board Software is incredibly useful tool that allows a team to work effective and productive, to analyze and improve the business processes, and visualize the workflows. ConceptDraw PRO with its numerous solutions is a powerful Kanban Board Software! Draw your own professional looking Kanban Board Diagrams quick, easy and effective with useful tools of ConceptDraw PRO diagramming and vector drawing software.HelpDesk
How to Create a Plant Layout Design
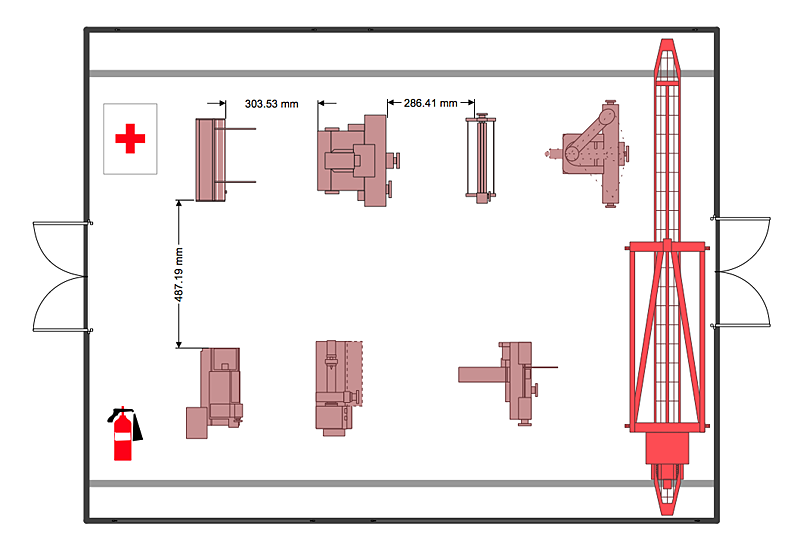
A plant construction process begins from a plant layout stage - an engineering stage used to design, analyze and finally choose the suitable configurations for a manufacturing plant. Plant Layout issues are core to any enterprise and are challenged in all types of manufacturing process. The sufficiency of layout influences the efficiency of subsequent operations. It is an important background for efficient manufacturing and also has a great deal with many questions. Once the place of the plant has been determined, the next important task before the management of the plant is to plan appropriate layout for the enterprise. Plant layout is used to create the most effective physical arrangement of machinery and equipment, with the plant building in such a manner so as to make quickest and cheapest way from a raw material to the shipment of the completed product Making a plan that shows the location of industrial equipment involves many different elements that can be managed using ConValue Stream & Process Flow Diagramming Software
Value Stream & Process Flow Diagramming Software is a very popular Lean Manufacturing tool that allows to see and visualize in details the company's processes and current state, the flow of material and information, and thus gives the possibility to analyze the efficiency of company's processes and then develop improved processes. Value stream maps are also a good way to define the steps that do not add value to the end product, in other words waste in a company's processes.
 Fishbone Diagrams
The Fishbone Diagrams solution extends ConceptDraw PRO v10 software with the ability to easily draw the Fishbone Diagrams (Ishikawa Diagrams) to clearly see the cause and effect analysis and also problem solving. The vector graphic diagrams produced using this solution can be used in whitepapers, presentations, datasheets, posters, and published technical material.
Value Stream Mapping Symbols
VSM symbols are the best for a production process designing. The entire Value Stream Mapping method uses a graphical representation of the manufacturing process, factors' pros and cons, that all stakeholders can easily understand. Value Stream Mapping is a graphical technique that provides possibilities to improve analysis of a manufacturing process, at the stage of the transferring information or materials that required to deliver a product or service to the customer.Work Order Process Flowchart. Business Process Mapping Examples
The business process is a set of actions or tasks which are undertaken by an organization for production some goods or services, they are then offered for the customers and are ordered by them. Process Flowcharts and Order Process Flowcharts are sufficiently prevalent, well known and actively used in variety of fields of life, business and science. They are constructed using the common standardized symbols, thus are clear and understandable for all. They help effectively represent the processes, determine the order in which the process activities happen, document the order processes, and also effectively analyze the processes with a goal to increase their efficiency. Create your own Process Flowcharts, Order Process Flowcharts, Cross-Functional Flow Charts representing the order processing steps using powerful drawing tools of ConceptDraw PRO software and variety of predesigned vector objects from the libraries of Business Process Mapping Solution from Business Processes area of ConceptDraw Solution Park.Total Quality Management Definition
The Total Quality Management Diagram solution helps you and your organization visualize business and industrial processes. Create Total Quality Management diagrams for business process with ConceptDraw software.
 Business Process Mapping
The Business Process Mapping solution for ConceptDraw PRO is for users involved in process mapping and creating SIPOC diagrams.
Value Stream Mapping Template
Use ConceptDraw PRO extended with Value Stream Mapping solution for document processes with professional designed Value Stream Mapping template.Form Maker
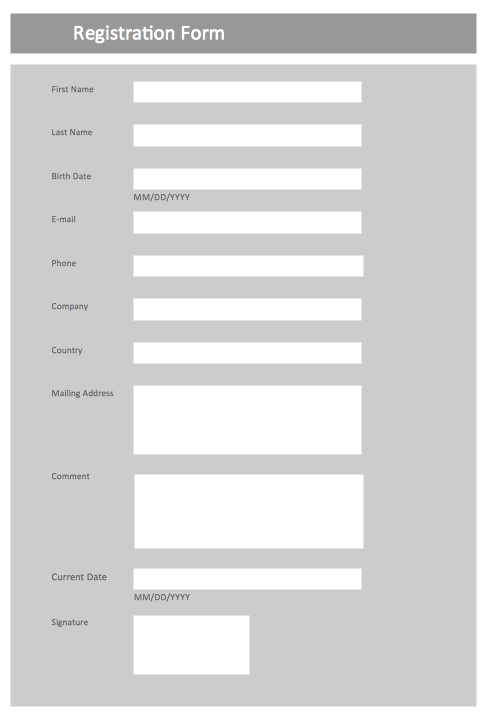
Use the Basic Diagramming Solution from the Universal Diagramming area of ConceptDraw Solution Park to easy create simple forms, questionnaires, survey forms, registration and application forms, etc.
 Value Stream Mapping
Value stream mapping solution extends ConceptDraw PRO software with templates, samples and vector stencils for drawing the Value Stream Maps (VSM) in lean manufacturing practice.
- Raw Material Chemical Flow Chart
- Block Diagram Of Materials Conversion Process
- Flow chart Example. Warehouse Flowchart | Material Requisition ...
- Raw Material Store Flowchart
- How to Draw a Chemical Process Flow Diagram
- Process Engineering | Process Flowchart | Process Flow Diagram ...
- Process Flow Diagram Symbols | Process Flowchart | Chemical and ...
- Unloading Process Flow Of Raw Materials
- Raw Material Flowchart
- Process Flow Diagram Symbols | Process Engineering | Process ...
- Flow chart Example. Warehouse Flowchart | Material Requisition ...
- Cross-Functional Flowchart | Design elements - Chemical ...
- Process Flowchart | Design elements - Chemical engineering | Flow ...
- Process Flow Diagram Symbols | Process Flowchart | How to Draw a ...
- Process Flowchart | Process Flow Diagram | Types of Flowcharts ...
- Flow Chart Raw Materials Purchasing Function
- Chemical and Process Engineering | Process Flow Diagram ...
- Process Flow Diagram Symbols | Chemical and Process ...
- Process Flow Diagram Symbols | Design elements - Chemical ...
- ER Diagram For Raw Material Stock Management System


