Planogram Software and Retail Plan Software

Flow chart Example. Warehouse Flowchart


Example of DFD for Online Store (Data Flow Diagram) DFD Example


Process Flowchart


Basic Flowchart Symbols and Meaning


 Logistics Flow Charts
Logistics Flow Charts solution extends ConceptDraw PRO v11 functionality with opportunities of powerful logistics management software. It provides large collection of predesigned vector logistic symbols, pictograms, objects and clipart to help you design with pleasure Logistics flow chart, Logistics process flow diagram, Inventory flow chart, Warehouse flowchart, Warehouse management flow chart, Inventory control flowchart, or any other Logistics diagram. Use this solution for logistics planning, to reflect logistics activities and processes of an enterprise or firm, to depict the company's supply chains, to demonstrate the ways of enhancing the economic stability on the market, to realize logistics reforms and effective products' promotion.
How to Present a Social Media Response Plan DFD to Your Team

Cross-Functional Flowchart


 Fishbone Diagrams
The Fishbone Diagrams solution extends ConceptDraw PRO v10 software with the ability to easily draw the Fishbone Diagrams (Ishikawa Diagrams) to clearly see the cause and effect analysis and also problem solving. The vector graphic diagrams produced using this solution can be used in whitepapers, presentations, datasheets, posters, and published technical material.
UML Component Diagram Example - Online Shopping

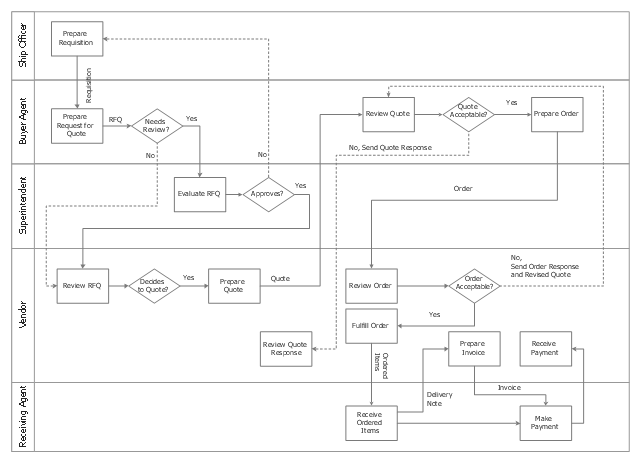
Swim Lane Flowchart Symbols

This swim lane diagram sample shows the trading process flow.
"Trade, also called goods exchange economy, is to transfer the ownership of goods from one person or entity to another by getting something in exchange from the buyer. Trade is sometimes loosely called commerce or financial transaction or barter. A network that allows trade is called a market. ...
Modern traders ... generally negotiate through a medium of exchange, such as money. As a result, buying can be separated from selling, or earning. ...
Retail trade consists of the sale of goods or merchandise from a very fixed location, such as a department store, boutique or kiosk, or by mail, in small or individual lots for direct consumption by the purchaser. Wholesale trade is defined as the sale of goods that are sold merchandise to retailers, to industrial, commercial, institutional, or other professional business users, or to other wholesalers and related subordinated services." [Trade. Wikipedia]
The swimlane diagram example "Process flowchart - Trading process" was created using the ConceptDraw PRO diagramming and vector drawing software extended with the Process Flowcharts solution from the Business Processes area of ConceptDraw Solution Park.
Swim lane diagram
Lean Six Sigma Diagram Software

Cross Functional Flowchart

- Example of DFD for Online Store (Data Flow Diagram ) DFD ...
- Process Flowchart | Flow chart Example. Warehouse Flowchart ...
- Store Layout Software | Planogram Software and Retail Plan ...
- Process Flowchart | Flow chart Example. Warehouse Flowchart ...
- Process Flowchart | Flow chart Example. Warehouse Flowchart ...
- Flow Chart And Diagram On Retail And Wholesale Trade
- ER Diagram Of Retail Store Management System
- Retail Store Flowchart
- Retail Flowchart
- Data Flow Diagram Retail Store
- Trading process diagram - Deployment flowchart | Cross-Functional ...
- Inventory Flow Chart In Retail Store
- Process Flow Chart For Store Department
- Example of DFD for Online Store (Data Flow Diagram ) DFD ...
- Example of DFD for Online Store (Data Flow Diagram ) DFD ...
- Process Flowchart | Flow chart Example. Warehouse Flowchart ...
- Retail Store Process Flow Chart
- Flow Chart Exaplain The Sales And Dispatch Of Product At A Retail
- Example of DFD for Online Store (Data Flow Diagram ) DFD ...
- Retail Store Flowchart Process Diagram