Financial Trade UML Use Case Diagram Example

Business and Finance Illustrations Example

UML Sequence Diagram Example. SVG Vectored UML Diagrams Tools

Settlement Process Flowchart. Flowchart Examples

SSADM Diagram

Diagramming Software for Design UML Use Case Diagrams


UML Use Case Diagram Example Registration System

Business - Design Elements

UML Class Diagram Tutorial

UML Use Case Diagram Example - Taxi Service

Jacobson Use Cases Diagram

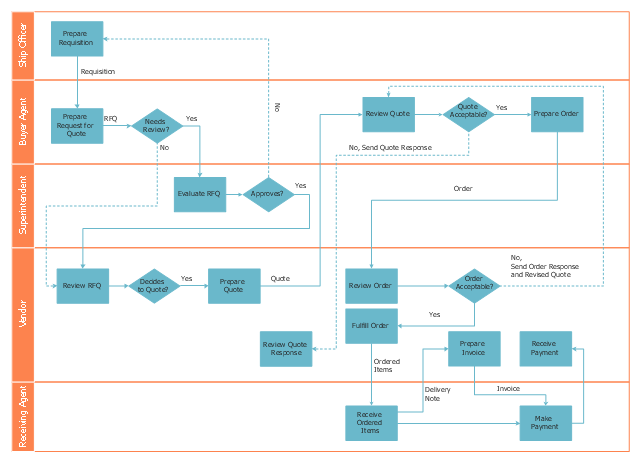
"Trade, also called goods exchange economy, is to transfer the ownership of goods from one person or entity to another by getting something in exchange from the buyer. Trade is sometimes loosely called commerce or financial transaction or barter. A network that allows trade is called a market. ...
Modern traders ... generally negotiate through a medium of exchange, such as money. As a result, buying can be separated from selling, or earning. ...
Retail trade consists of the sale of goods or merchandise from a very fixed location, such as a department store, boutique or kiosk, or by mail, in small or individual lots for direct consumption by the purchaser. Wholesale trade is defined as the sale of goods that are sold merchandise to retailers, to industrial, commercial, institutional, or other professional business users, or to other wholesalers and related subordinated services." [Trade. Wikipedia]
The deployment flow chart example "Trading process diagram" was created using the ConceptDraw PRO diagramming and vector drawing software extended with the Cross-Functional Flowcharts solution from the Business Processes area of ConceptDraw Solution Park.
Deployment flowchart
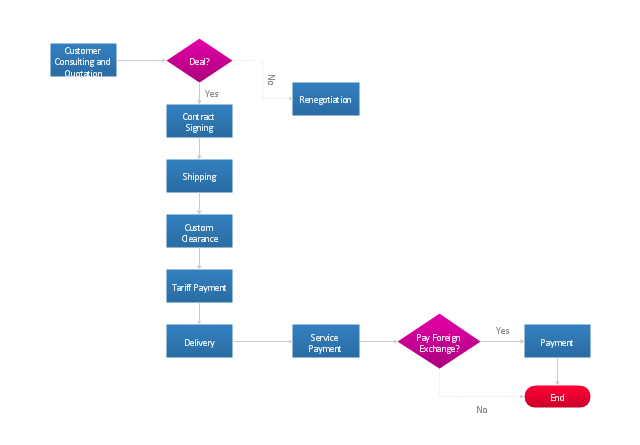
"An import is a good brought into a jurisdiction, especially across a national border, from an external source. The purchaser of the exotic good is called an importer. An import in the receiving country is an export from the sending country. Importation and exportation are the defining financial transactions of international trade.
In international trade, the importation and exportation of goods are limited by import quotas and mandates from the customs authority. The importing and exporting jurisdictions may impose a tariff (tax) on the goods. In addition, the importation and exportation of goods are subject to trade agreements between the importing and exporting jurisdictions." [Import. Wikipedia]
The flow chart example "Import process" was created using the ConceptDraw PRO diagramming and vector drawing software extended with the Flowcharts solution from the area "What is a Diagram" of ConceptDraw Solution Park.
Flowchart - Import process
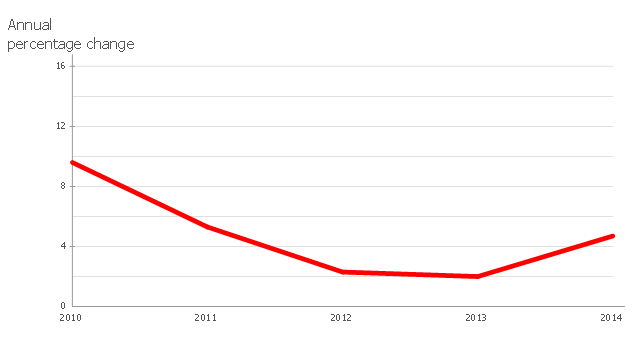
The line graph example "France exports of goods and services" depicts data from the European Economic Forecast (EUROPEAN ECONOMY 1|2013, Economic and Financial Affairs Winter 2013, European Commission)
[ec.europa.eu/ economy_ finance/ publications/ european_ economy/ 2013/ pdf/ ee1_ en.pdf].
"Exports in France decreased to 36526 EUR Million in October of 2013 from 36637 EUR Million in September of 2013. Exports in France is reported by the Ministère de l'Économie et des Finances. Exports in France averaged 17102.29 EUR Million from 1970 until 2013, reaching an all time high of 37964 EUR Million in August of 2012 and a record low of 1165.60 EUR Million in May of 1970. France is one of the largest exporters of luxury goods and agricultural products in the world. France main exports are: aircrafts (10.1 percent of total exports), food (9.7 percent), chemicals (9.5 percent), industrial machinery (8.3 percent), iron and steel (7.9 percent), electronics (6.7 percent), motor vehicles (6.3 percent) and pharmaceuticals (6.1 percent). Trade outflows to Europe account for 70 percent of total exports. Main export partners are: Germany (16.6 percent of total exports), Italy (8.2 percent), Spain (7.3 percent), Belgium (7.2 percent), the United Kingdom (6.6 percent), the United States (5.6 percent), Netherlands and China. This page contains - France Exports - actual values, historical data, forecast, chart, statistics, economic calendar and news." [tradingeconomics.com/ france/ exports]
The line graph example "France exports of goods and services" was created using ConceptDraw PRO diagramming and vector drawing software extended with Line Graphs solution from Graphs and Charts area of ConceptDraw Solution Park.
Line chart
- Financial Trade UML Use Case Diagram Example | Settlement ...
- Business and Finance | Financial Trade UML Use Case Diagram ...
- Financial Trade UML Use Case Diagram Example
- Financial Trade UML Use Case Diagram Example | Rapid UML ...
- Financial Trade UML Use Case Diagram Example | UML Diagram ...
- Financial Trade UML Use Case Diagram Example | Diagramming ...
- Office Layout Plans | Financial Trade UML Use Case Diagram ...
- Financial Trade UML Use Case Diagram Example | Business and ...
- UML Diagram | Financial Trade UML Use Case Diagram Example ...
- Financial Trade UML Use Case Diagram Example | Audit Flowcharts ...
- Business and Finance Illustrations Example | Financial Trade UML ...
- Financial Trade UML Use Case Diagram Example | Types of ...
- Trading process diagram - Deployment flowchart | Financial Trade ...
- Process Flowchart | Financial Trade UML Use Case Diagram ...
- UML Class Diagram Tutorial | Financial Trade UML Use Case ...
- UML Sequence Diagram Example . SVG Vectored UML Diagrams ...
- Financial Trade UML Use Case Diagram Example | Business ...
- Audit Flowcharts | Financial Trade UML Use Case Diagram Example ...
- Financial Trade UML Use Case Diagram Example
- UML Use Case Diagram Example . Services UML Diagram. ATM ...