Mathematics Symbols

Mathematical Diagrams

Physics Symbols

Scientific Symbols Chart

Mathematics Solution from the Science and Education area of ConceptDraw Solution Park includes a few shape libraries of plane, solid geometric figures, trigonometrical functions and greek letters to help you create different professional looking mathematic illustrations for science and education.
UML State Machine Diagram.Design Elements

Venn Diagrams

Process Engineering
Venn Diagram Examples for Problem Solving. Venn Diagram as a Truth Table

Basic Diagramming


Bar Diagrams for Problem Solving. Create space science bar charts with Bar Graphs Solution

UML Notation

Software Diagrams

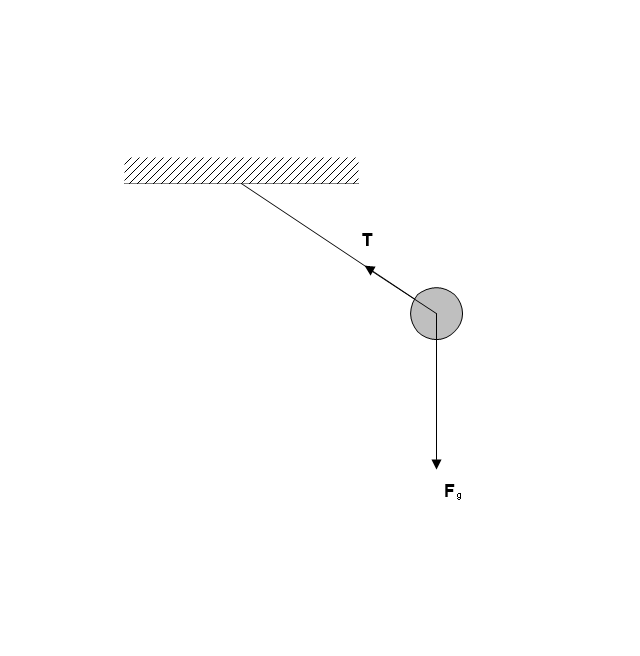
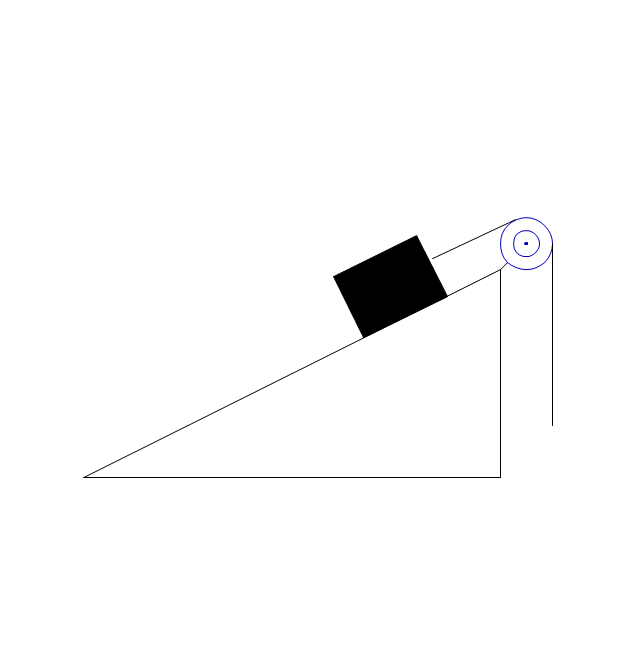
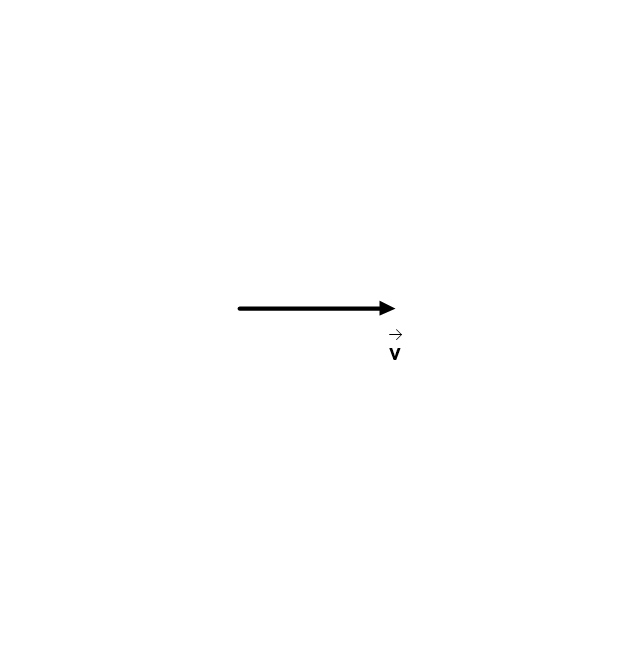
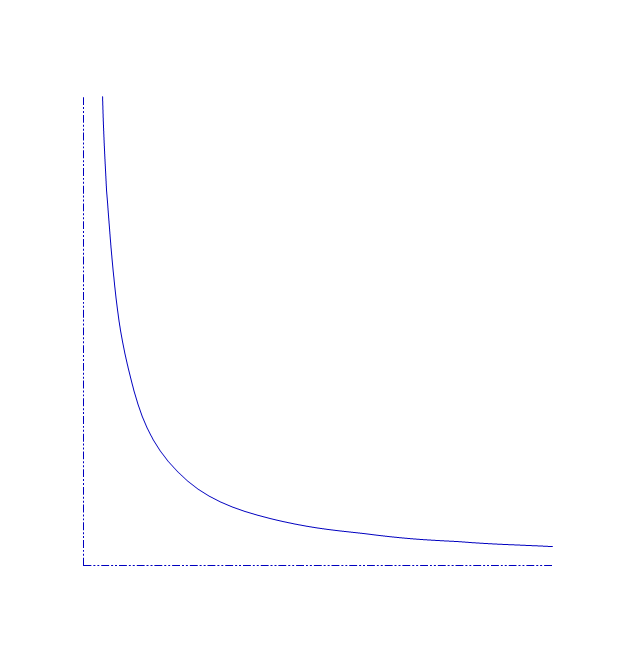
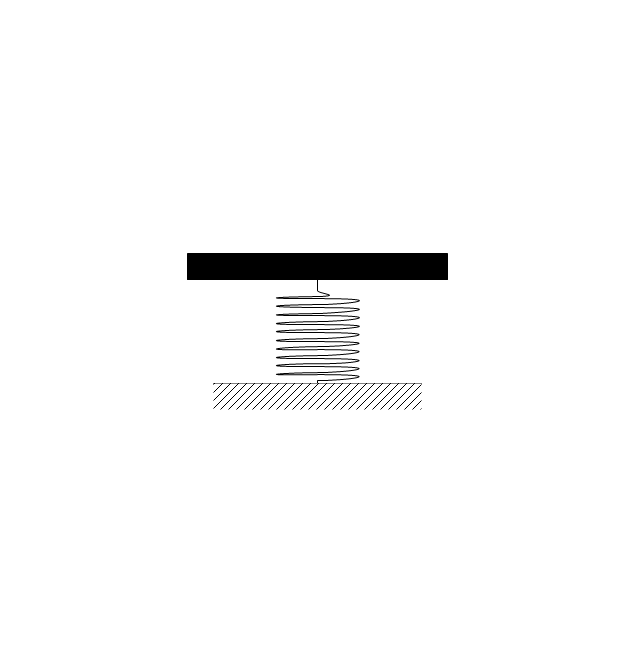
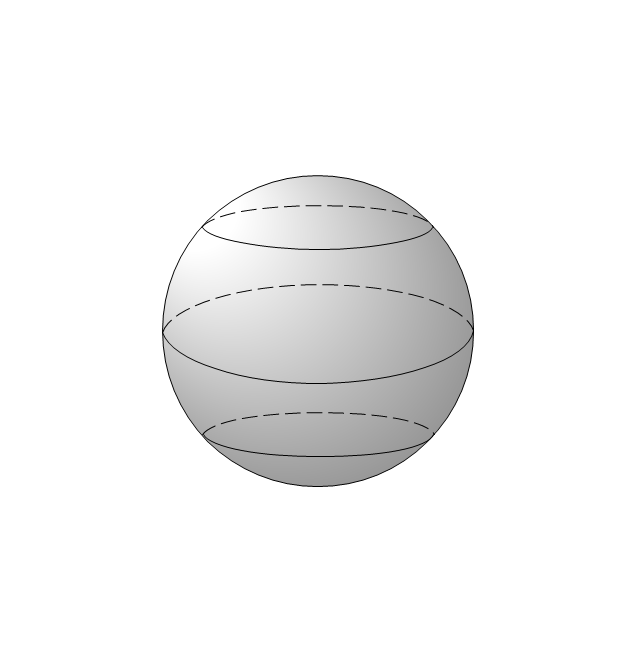
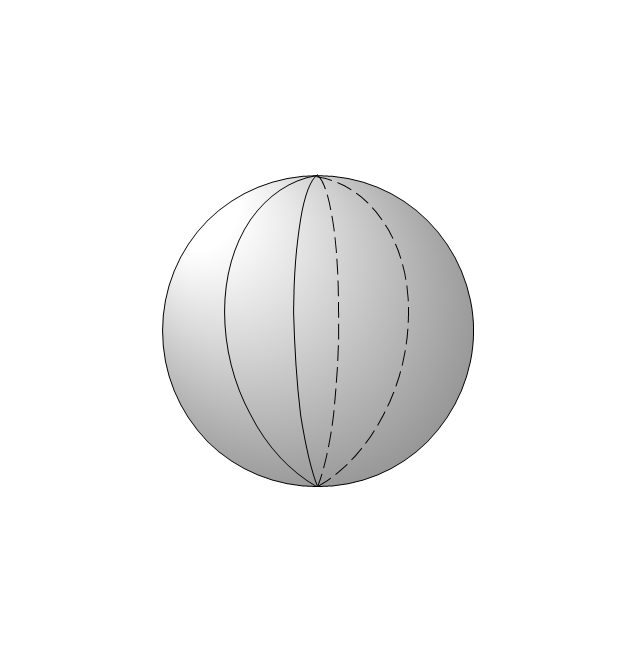
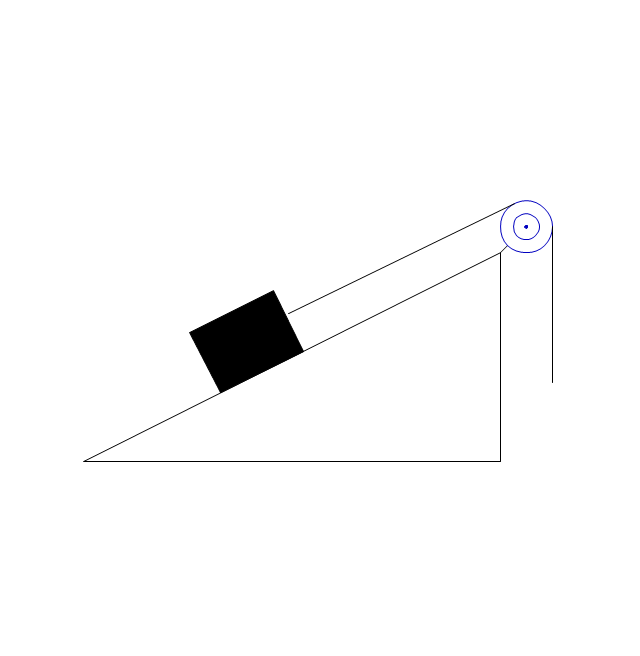
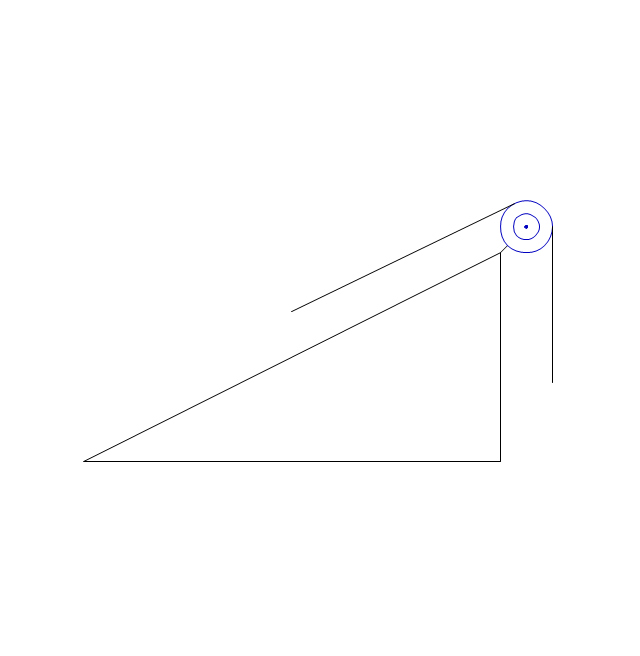
The vector stencils library "Mechanics" contains 29 mechanical symbols.
Use these shapes for drawing mechanics experiment schemes and physical diagrams in the ConceptDraw PRO diagramming and vector drawing software extended with the Physics solution from the Science and Education area of ConceptDraw Solution Park.
www.conceptdraw.com/ solution-park/ science-education-physics
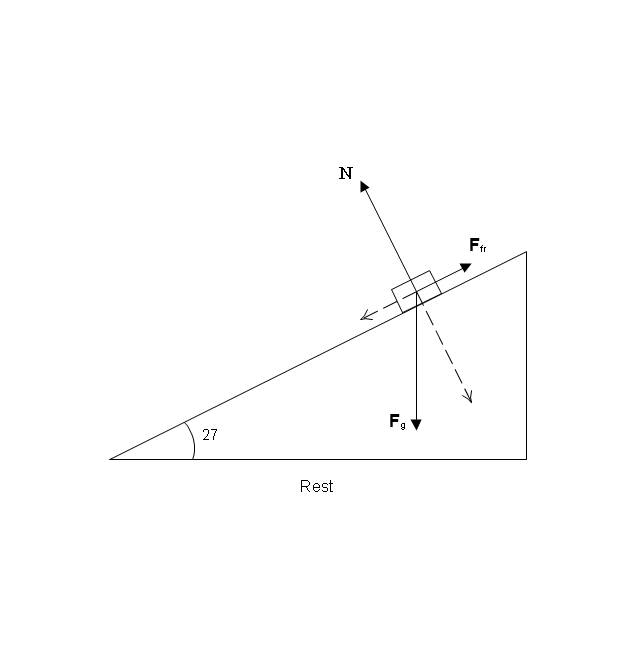
Rest

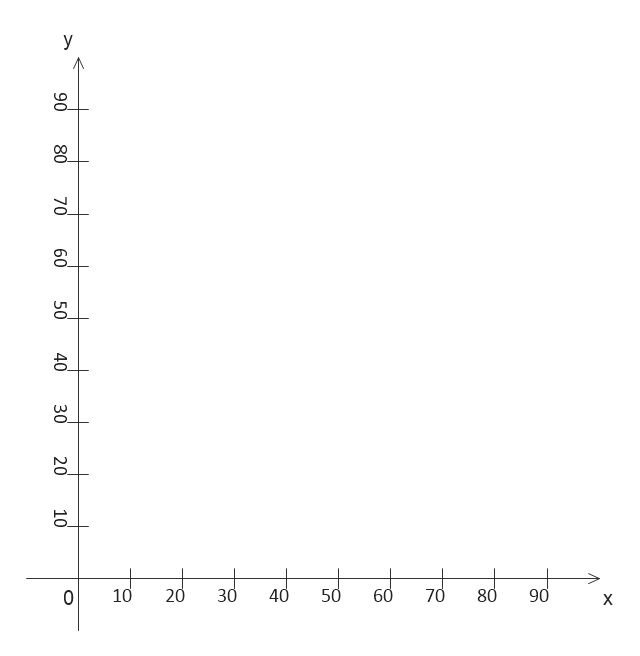
Co-ordinates
Inclined plane
Block

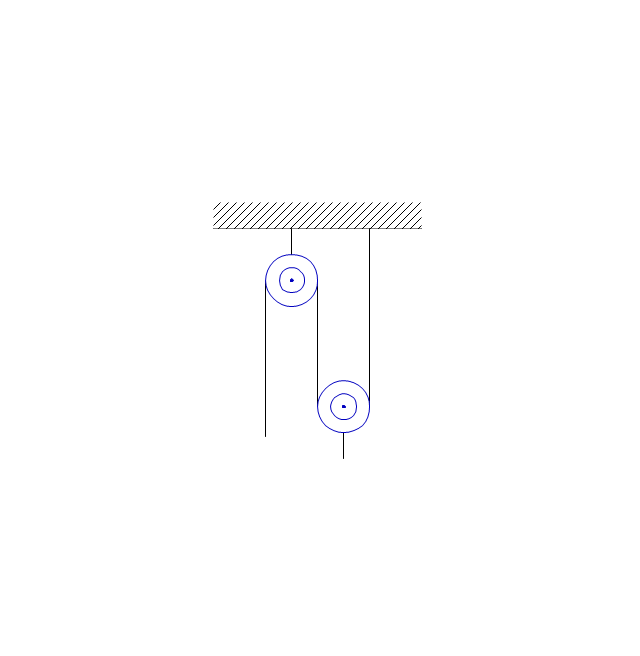
Block System
Mathematical pendulum
Inclined plane with block
Vector
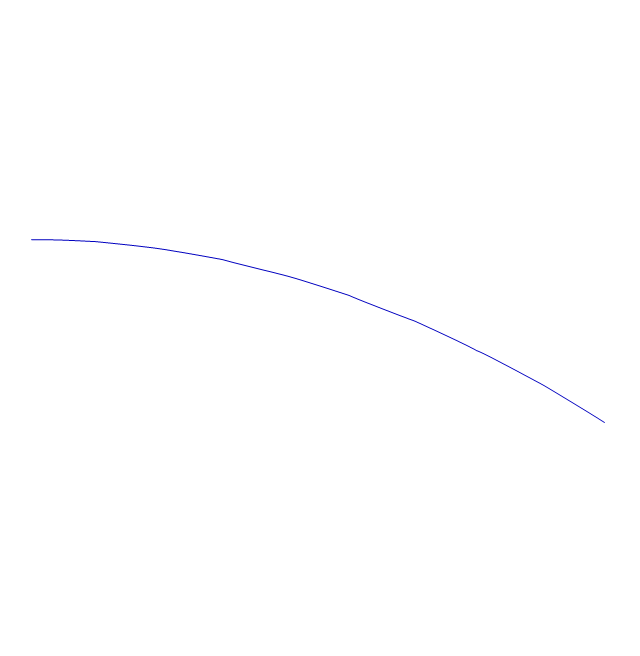
Parabolic motion path

Parabolic motion path

Hyperbolic motion path
Parabolic motion path
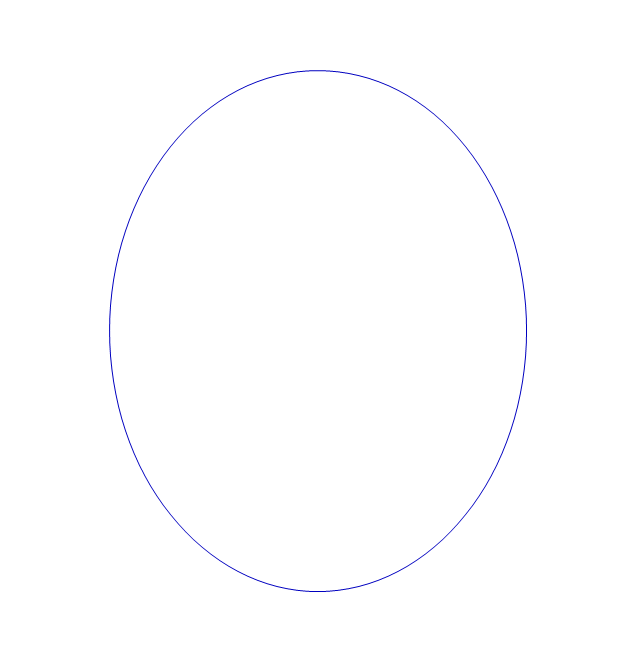
Elliptical motion path
Spring

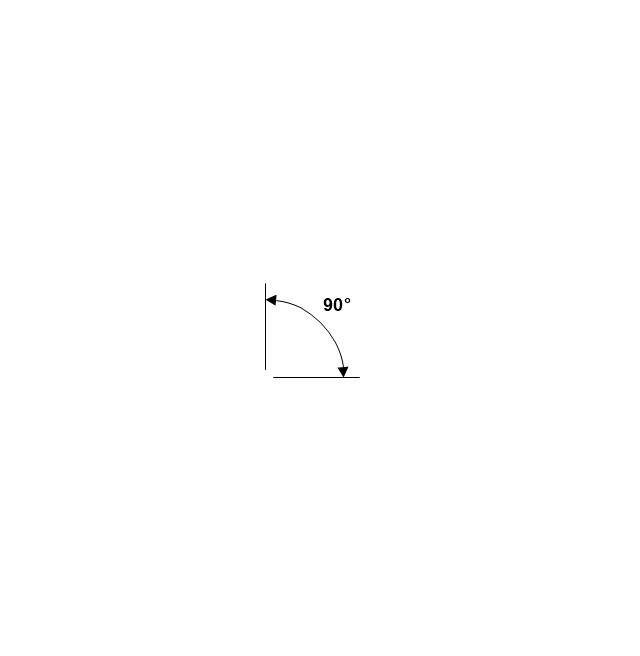
Angle
Linear motion path

Stub Reinforcement

Stick

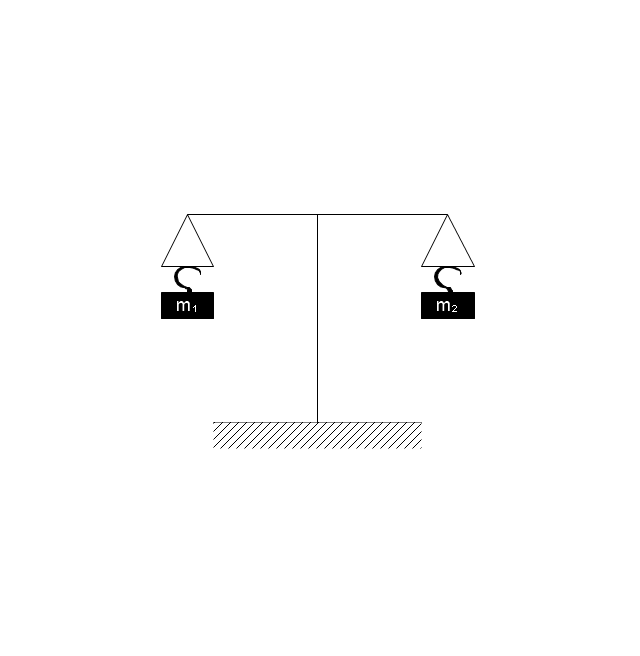
Beam balance

Beam balance 2
Spring Balance
Ball
Weight

Weight, hook

Globe, parallels, meridians

Globe, parallels
Globe, meridians
Inclined plane with block 2
Inclined plane 2
How to Create a Pyramid Diagram

Venn Diagram Examples for Problem Solving

- Mathematical Shapes Symbols And Figure
- Mathematical Shapes Symbols And Figures
- Using Mathematical Shapes Symbols And Figures
- How to Draw Geometric Shapes in ConceptDraw PRO ...
- 5 Desgin Mathematical Shapes Symbols And Figure
- Drawing Geometric Shapes Software
- Mathematics Shapes Symbols And Figures
- Draw The Diagrams Of Mathematics Different Shapes
- Shapes Of Mathematical Symbols
- Geometric Shapes And Their Plan Figures
- Mathematical Diagrams | How to Draw Geometric Shapes in ...
- Basic Diagramming | Mathematical Diagrams | Mathematics ...
- Make A Diagram Or Model Using Geometric Figures
- Pictures Using Different Mathematical Shapes
- Draw Geometric Shapes Software
- Basic Diagramming | Mathematical Diagrams | How to Draw ...
- Mathematical Diagrams | How to Draw Geometric Shapes in ...
- How to Draw Geometric Shapes in ConceptDraw PRO | Basic ...
- How to Draw Geometric Shapes in ConceptDraw PRO ...
- Mathematical Diagrams | Mathematics Symbols | Basic Flowchart ...