HelpDesk
How to Track Your Project Plan vs. the Actual Project Condition

Gantt Chart Software

HelpDesk
How to Export Project Data to MS Excel Worksheet

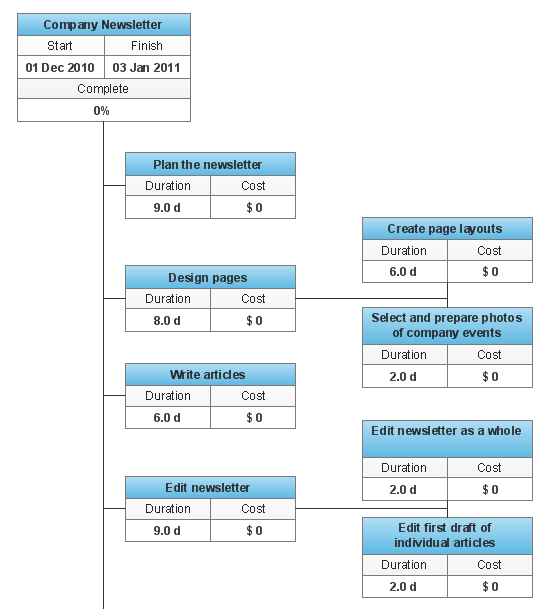
How to Create Gantt Chart

Project — Working With Costs

Dashboard

 Status Dashboard
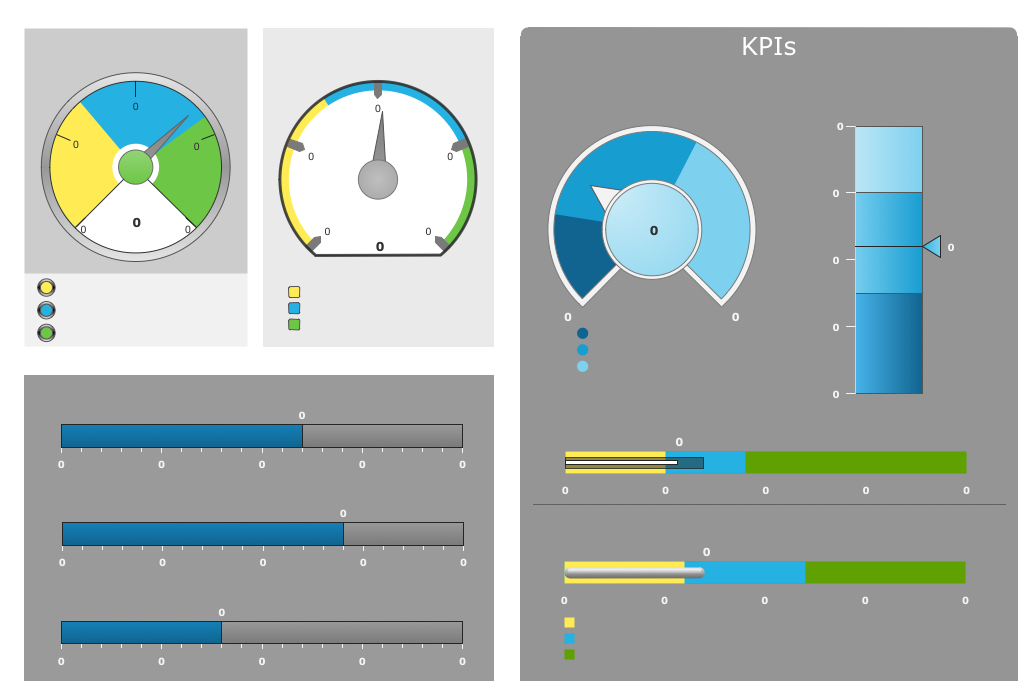
Status dashboard solution extends ConceptDraw DIAGRAM software with templates, samples and vector stencils libraries with graphic indicators for drawing the visual dashboards showing status data.
 PM Planning
The PM Planning solution extends the functional abilities of ConceptDraw MINDMAP and ConceptDraw PROJECT software, allowing to automatically create the spreadsheets reflecting the tasks and project statuses for people who have different project roles. The reporting capabilities of this solution are represented by the possibility to generate a wide range of project reports that allow the project managers, senior management and other project participants to be informed on a project daily progress and monthly objectives: All Inclusive Report, All Visible Columns, Milestones with Notes and Objectives, Projects Goals, Projects Managers, Project Team, and Top Level Tasks. The PM Planning solution from ConceptDraw Solution Park is a strong project management and productivity tool which simplifies the process of reporting and lets one create a document with the desired report, includes the predesigned examples, extends and improves the planning capabilities for all team members, improves the project communication, helps to accurately plan, maintain, and finish projects on time, to track the work of project resources, to perform the analytical work and to make effective decisions.
Empower Your Sales Team With a Sales Dashboard
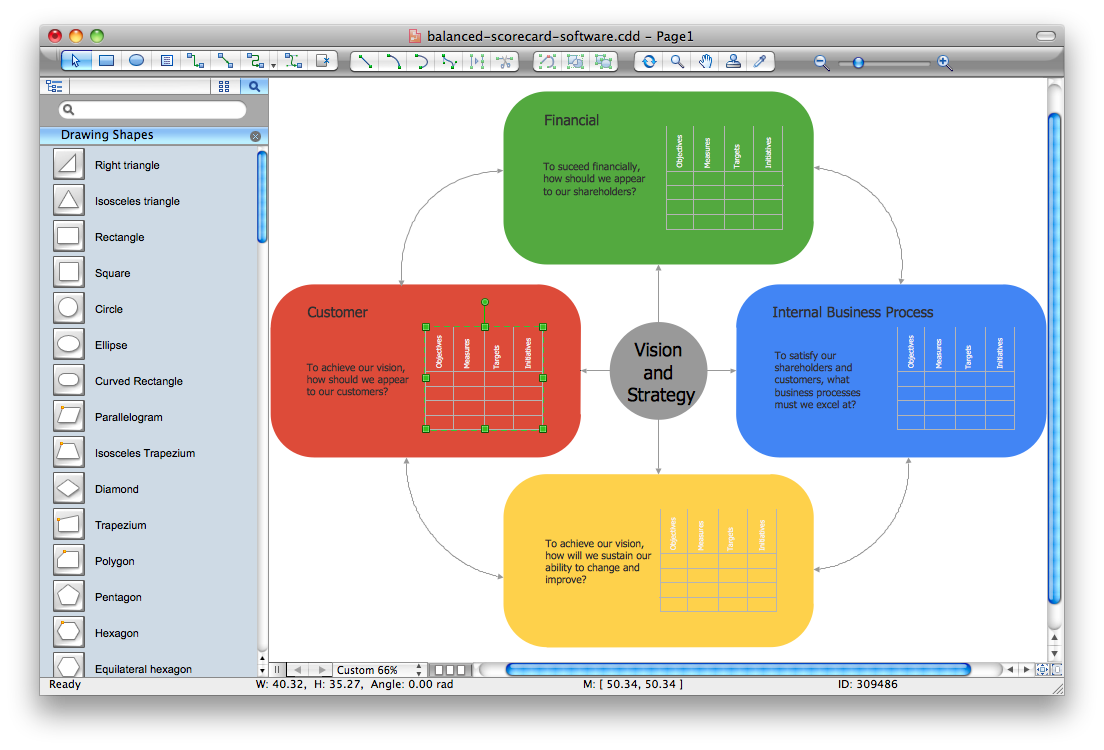
Balanced Scorecard Software
Product Overview

PERT Chart Software

Gane Sarson Diagram

Network Visualization with ConceptDraw DIAGRAM

WBS Diagram
- Dashboard | Performance Indicators | Status Dashboard | Tasks Kpi ...
- How to Export Project Data to MS Excel Worksheet | How to Track ...
- PM Dashboards | Project management task status dashboard | How ...
- Status Dashboard | A KPI Dashboard Provides the Answers Your ...
- Status Dashboard | Design elements - Composition charts and ...
- How to Manage Multiple Projects on Windows | How to Manage ...
- How to Report Task's Execution with Gantt Chart | Gantt Chart ...
- Project task status dashboard - Template | A KPI Dashboard ...
- Ms Project Dashboard Report
- Status Dashboard | Dashboard | Project task status dashboard ...
- Progress Tracking Dashboard
- Status Dashboard | PM Planning | Gantt Chart Software | Excel ...
- Status Dashboard | PM Dashboards | Project task status dashboard ...
- PM Dashboards | Project management task status dashboard | A KPI ...
- How to Track Your Project Plan vs. the Actual Project Condition ...
- PM Planning | Performance Indicators | Status Dashboard | Progress ...
- Gantt charts for planning and scheduling projects | How to Report ...
- Dashboard | How to Track Your Project Plan vs. the Actual Project ...
- How to Export Project Data to MS Excel Worksheet | How to Track ...
- Excel Dashboard Multiple Projects Tracking