Target Diagram

 Target and Circular Diagrams
This solution extends ConceptDraw PRO software with samples, templates and library of design elements for drawing the Target and Circular Diagrams.
Daily Schedule Chart

Circular Diagram

The Circular Flow Diagram

Circle Spoke Diagram Template

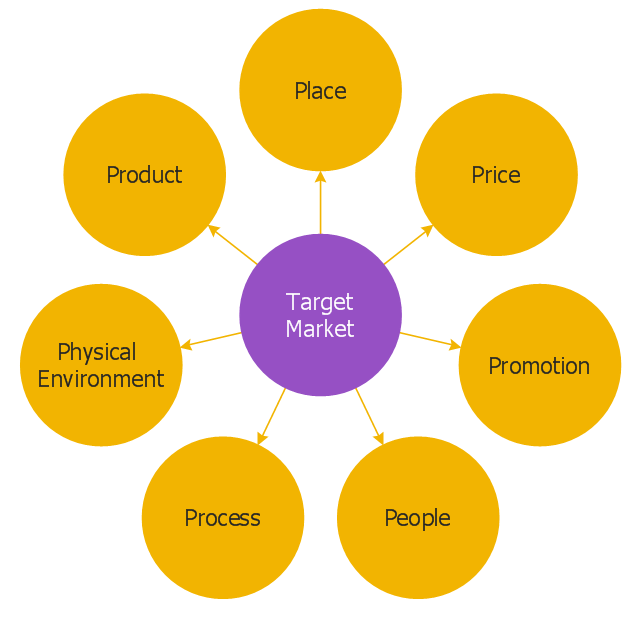
"A target market is a group of customers towards which a business has decided to aim its marketing efforts and ultimately its merchandise. A well-defined target market is the first element to a marketing strategy. The marketing mix variables of product, place (distribution), promotion and price are the four elements of a marketing mix strategy that determine the success of a product in the marketplace." [Target market. Wikipedia]
The circle-spoke diagram example "Target market" was created using the ConceptDraw PRO diagramming and vector drawing software extended with the Circle-Spoke Diagrams solution from the area "What is a Diagram" of ConceptDraw Solution Park.
The circle-spoke diagram example "Target market" was created using the ConceptDraw PRO diagramming and vector drawing software extended with the Circle-Spoke Diagrams solution from the area "What is a Diagram" of ConceptDraw Solution Park.
Circle-spoke diagram
 Circle-Spoke Diagrams
Circle-spoke diagrams solution extends ConceptDraw PRO software with samples, template and library of vector stencils for drawing the circle spoke diagrams.
 Event-driven Process Chain (EPC) Diagrams
Event-driven Process Chain (EPC) Diagram is a type of flowchart widely used for modeling in business engineering and reengineering, business process improvement, and analysis. EPC method was developed within the Architecture of Integrated Information Systems (ARIS) framework.
Bar Diagrams for Problem Solving. Create event management bar charts with Bar Graphs Solution

 Marketing
This solution extends ConceptDraw PRO v9 and ConceptDraw MINDMAP v7 with Marketing Diagrams and Mind Maps (brainstorming, preparing and holding meetings and presentations, sales calls).
 Enterprise Architecture Diagrams
Enterprise Architecture Diagrams solution extends ConceptDraw PRO software with templates, samples and library of vector stencils for drawing the diagrams of enterprise architecture models.
"Advanced Persistent Threat (APT) APT is a set of stealthy and continuous hacking processes often orchestrated by human targeting a specific entity. APT usually targets organizations and or nations for business or political motives. APT processes require high degree of covertness over a long period of time. As the name implies, APT consists of three major components/ processes: advanced, persistent, and threat. The advanced process signifies sophisticated techniques using malware to exploit vulnerabilities in systems. The persistent process suggests that an external command and control is continuously monitoring and extracting data off a specific target. The threat process indicates human involvement in orchestrating the attack.
APT usually refers to a group, such as a government, with both the capability and the intent to persistently and effectively target a specific entity. The term is commonly used to refer to cyber threats, in particular that of Internet-enabled espionage using a variety of intelligence gathering techniques to access sensitive information, but applies equally to other threats such as that of traditional espionage or attack. Other recognized attack vectors include infected media, supply chain compromise, and social engineering. Individuals, such as an individual hacker, are not usually referred to as an APT as they rarely have the resources to be both advanced and persistent even if they are intent on gaining access to, or attacking, a specific target." [Advanced persistent threat. Wikipedia]
This circular arrows diagram example was redesigned from the Wikimedia Commons file: Advanced persistent threat lifecycle.jpg.
[commons.wikimedia.org/ wiki/ File:Advanced_ persistent_ threat_ lifecycle.jpg]
This file is licensed under the Creative Commons Attribution-Share Alike 3.0 Unported license. [creativecommons.org/ licenses/ by-sa/ 3.0/ deed.en]
The example "Advanced persistent threat lifecycle" was created using the ConceptDraw PRO diagramming and vector drawing software extended with the Circular Arrows Diagrams solution from the area "What is a Diagram" of ConceptDraw Solution Park.
Circular arrows diagram

The cycle diagram sample was created on the base of the figure illustrating the webpage "2. POLICY & STRATEGY" of "Scottish Police College Primary Inspection 2006: A Report by Her Majesty's Inspectorate of Constabulary" from the Scottish Government website.
"Strategic Planning.
2.1 The planning process for the College currently follows a structured approach, starting in April and extending through the financial year. The planning cycle is illustrated in figure 2. ...
2.2 The College recognises the need to consult with its customers and stakeholders in the process of setting objectives and directing the training programme. The planning cycle to date refers to force visits, environmental scanning, the course planning process which involves consultation with all forces and other common police services, as well as to a survey of external providers.
2.3 The information from consultation feeds into an EFQM framework from which the College has identified four key policies, namely:
(1) developing and delivering quality training;
(2) developing our people through lifelong learning;
(3) continuous improvement of our service; and
(4) embracing the changing environment.
2.4 The objectives set at divisional level are designed to contribute to delivering these policies. HMIC found that whilst the selected objectives were presented in line with the structure, not all could be considered to meet SMART (Specific, Measurable, Achievable, Relevant and Timed) criteria. This failure indicates that while the process appears suitably structured to deliver a robust result, some of those involved could perhaps have a better understanding of the process." [scotland.gov.uk/ Publications/ 2007/ 02/ 15134652/ 8]
The cycle diagram example "Strategic planning" was created using the ConceptDraw PRO diagramming and vector drawing software extended with the Target and Circular Diagrams solution from the Marketing area of ConceptDraw Solution Park.
www.conceptdraw.com/ solution-park/ marketing-target-and-circular-diagrams
Cycle diagram

 Office Layout Plans
Office layouts and office plans are a special category of building plans and are often an obligatory requirement for precise and correct construction, design and exploitation office premises and business buildings. Designers and architects strive to make office plans and office floor plans simple and accurate, but at the same time unique, elegant, creative, and even extraordinary to easily increase the effectiveness of the work while attracting a large number of clients.
This hexagon diagram sample was redesigned from the Wikipedia file: Virtuous circle in macroeconomics.svg. "An example of the use of a virtuous circle in macroeconomics."
[en.wikipedia.org/ wiki/ File:Virtuous_ circle_ in_ macroeconomics.svg]
"A virtuous circle and a vicious circle (also referred to as virtuous cycle and vicious cycle) are economic terms. They refer to a complex chain of events that reinforces itself through a feedback loop. A virtuous circle has favorable results, while a vicious circle has detrimental results.
Both circles are complexes of events with no tendency towards equilibrium (at least in the short run). Both systems of events have feedback loops in which each iteration of the cycle reinforces the previous one (positive feedback). These cycles will continue in the direction of their momentum until an external factor intervenes and breaks the cycle. The prefix "hyper-" is sometimes used to describe these cycles if they are extreme. The best-known example of a vicious circle is hyperinflation. ...
Example in macroeconomics.
Virtuous circle.
Economic growth can be seen as a virtuous circle. It might start with an exogenous factor such as technological innovation. As people get familiar with the new technology, there could be learning curve effects and economies of scale. This could lead to reduced costs and improved production efficiencies. In a competitive market structure, this will probably result in lower average prices or a decrease in employment as it takes fewer workers to produce the same output. As prices decrease, consumption could increase and aggregate output also. Increased levels of output lead to more learning and scale effects and a new cycle starts."
[en.wikipedia.org/ wiki/ Virtuous_ circle_ and_ vicious_ circle]
The crystal diagram example "Virtuous circle (macroeconomics)" was created using the ConceptDraw PRO diagramming and vector drawing software extended with the Target and Circular Diagrams solution from the Marketing area of ConceptDraw Solution Park.
www.conceptdraw.com/ solution-park/ marketing-target-and-circular-diagrams
Hexagon diagram
---crystal-diagram.png--diagram-flowchart-example.png)
Audio and Video Connections Explained

This ring chart sample was redesigned from the Wikipedia file: Virtuous circle in management.svg.
"An example of the use of a virtuous circle in management."
[en.wikipedia.org/ wiki/ File:Virtuous_ circle_ in_ management.svg]
"A virtuous circle and a vicious circle (also referred to as virtuous cycle and vicious cycle) are economic terms. They refer to a complex chain of events that reinforces itself through a feedback loop. A virtuous circle has favorable results, while a vicious circle has detrimental results.
Both circles are complexes of events with no tendency towards equilibrium (at least in the short run). Both systems of events have feedback loops in which each iteration of the cycle reinforces the previous one (positive feedback). These cycles will continue in the direction of their momentum until an external factor intervenes and breaks the cycle. The prefix "hyper-" is sometimes used to describe these cycles if they are extreme. The best-known example of a vicious circle is hyperinflation. ...
Example in management.
Virtuous circle.
An employer's investment in his employees’ ability to provide superior service to customers can be seen as a virtuous circle. Effort spent in selecting and training employees and creating a corporate culture in which they are empowered can lead to increased employee satisfaction and employee competence. This can result in superior service delivery and customer satisfaction. This in turn will create customer loyalty, improved sales levels, and higher profit margins. Some of these profits can be reinvested in employee development, thereby initiating another iteration of a virtuous cycle." [en.wikipedia.org/ wiki/ Virtuous_ circle_ and_ vicious_ circle]
The ring chart example "Virtuous circle (management)" was created using the ConceptDraw PRO diagramming and vector drawing software extended with the Target and Circular Diagrams solution from the Marketing area of ConceptDraw Solution Park.
www.conceptdraw.com/ solution-park/ marketing-target-and-circular-diagrams
Ring chart
---ring-chart.png--diagram-flowchart-example.png)
This hexagon diagram sample was redesigned from the Wikipedia file: Vicious circle in macroeconomics.svg. "An example of the use of a vicious circle in macroeconomics." [en.wikipedia.org/ wiki/ File:Vicious_ circle_ in_ macroeconomics.svg]
"A virtuous circle and a vicious circle (also referred to as virtuous cycle and vicious cycle) are economic terms. They refer to a complex chain of events that reinforces itself through a feedback loop. A virtuous circle has favorable results, while a vicious circle has detrimental results.
Both circles are complexes of events with no tendency towards equilibrium (at least in the short run). Both systems of events have feedback loops in which each iteration of the cycle reinforces the previous one (positive feedback). These cycles will continue in the direction of their momentum until an external factor intervenes and breaks the cycle. The prefix "hyper-" is sometimes used to describe these cycles if they are extreme. The best-known example of a vicious circle is hyperinflation. ...
Example in macroeconomics.
Vicious circle.
Hyperinflation is a spiral of inflation which causes even higher inflation. The initial exogenous event might be a sudden large increase in international interest rates or a massive increase in government debt due to excessive spendings. Whatever the cause, the government could pay down some of its debt by printing more money (called monetizing the debt). This increase in the money supply could increase the level of inflation. In an inflationary environment, people tend to spend their money quickly because they expect its value to decrease further in the future. They convert their financial assets into physical assets while their money still has some purchasing power. Often they will purchase on credit. Eventually, the currency loses all of its value. Because of this, the level of savings in the country is very low and the government could have problems refinancing its debt. Its solution could be to print still more money starting another iteration of the vicious cycle." [Virtuous circle and vicious circle. Wikipedia]
The crystal diagram example "Vicious circle" was created using the ConceptDraw PRO diagramming and vector drawing software extended with the Target and Circular Diagrams solution from the Marketing area of ConceptDraw Solution Park.
www.conceptdraw.com/ solution-park/ marketing-target-and-circular-diagrams
Hexagon diagram

 Cross-Functional Flowcharts
Cross-functional flowcharts are powerful and useful tool for visualizing and analyzing complex business processes which requires involvement of multiple people, teams or even departments. They let clearly represent a sequence of the process steps, the order of operations, relationships between processes and responsible functional units (such as departments or positions).
- Target Diagram Examples
- Target and Circular Diagrams | Business diagrams & Org Charts ...
- Circular Arrows Diagrams | Target and Circular Diagrams ...
- Circle-spoke diagram template - Target market | Pie Chart Examples ...
- Design elements - Target and circular diagrams | Arrow pie chart ...
- Target market - Onion diagram | Circle-spoke diagram - Target ...
- Pyramid Chart Examples | Target and Circular Diagrams | Block ...
- Marketing Diagrams | Pyramid Chart Examples | Circle-spoke ...
- Marketing mix - Wheel diagram | Target market - Onion diagram ...
- Target and Circular Diagrams | Pyramid Chart Examples | Brand ...
- Settlement Process Flowchart. Flowchart Examples | Target and ...
- Foreign trade - Onion diagram | Settlement Process Flowchart ...
- Brand essence model - Wheel diagram | Pyramid Chart Examples ...
- Target Diagram
- Target For Business Diagram
- Marketing Diagrams | Marketing mix - Wheel diagram | Circle-spoke ...
- Target and Circular Diagrams | Circular Arrows Diagrams | Circular ...
- Target diagrams - Vector stencils library | Venn Diagram Examples ...
- Manufacturing and Maintenance | Target and Circular Diagrams ...
- Target and Circular Diagrams | Pyramid Chart Examples | Brand ...