SWOT Analysis

Swot Analysis Examples

How to Make SWOT Analysis in a Word Document

 SWOT Analysis
SWOT and TOWS Matrix Diagrams solution extends ConceptDraw DIAGRAM and ConceptDraw MINDMAP software with features, templates, samples and libraries of vector stencils for drawing SWOT and TOWS analysis matrices and mind maps.
HelpDesk
How to Create a SWOT Matrix Quickly

What is SWOT Analysis in Marketing

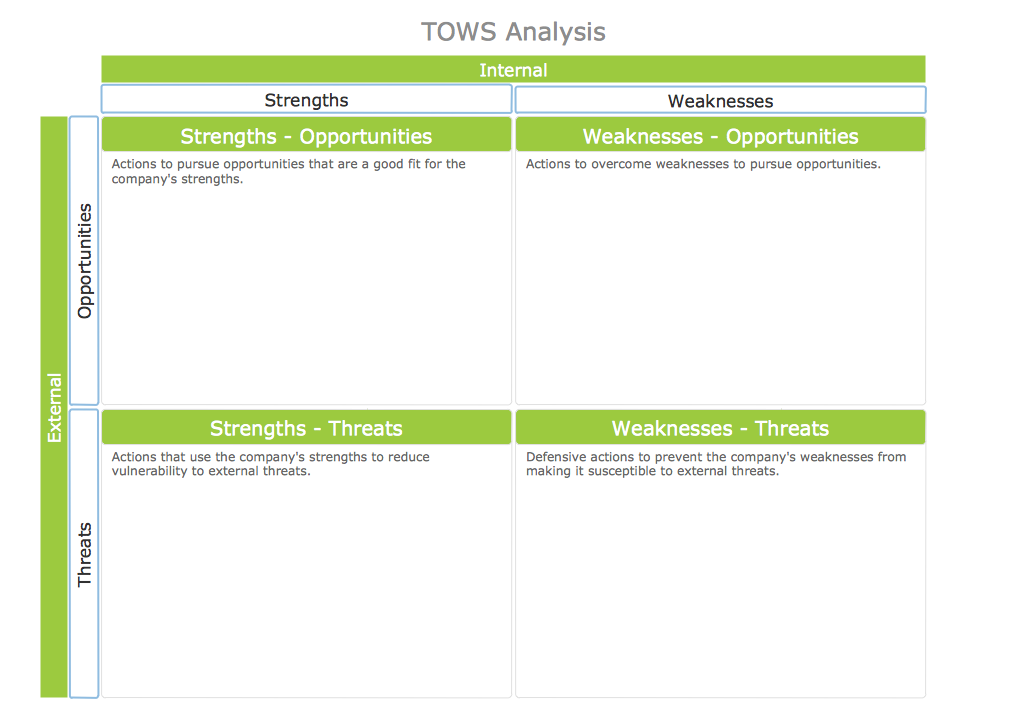
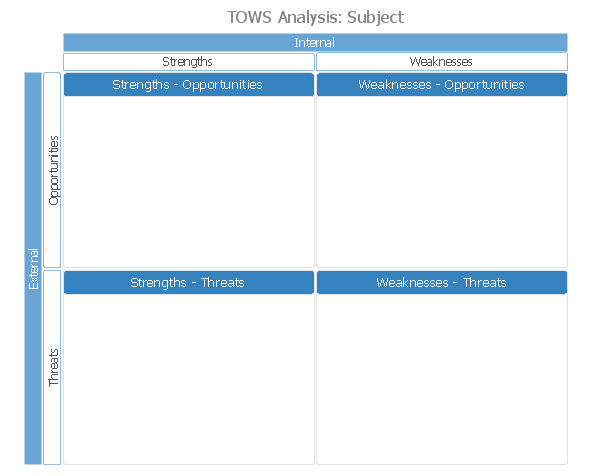
TOWS Analysis
What is SWOT Analysis?

HelpDesk
How to Create SWOT Analysis Template

TOWS Matrix

HelpDesk
How to Make SWOT Analysis in a Word Document

TOWS Analysis Software
"SWOT analysis is an analytical method which is used to identify and categorise significant internal (Strengths and Weaknesses) and external (Opportunities and Threats) factors faced either in a particular arena, such as an organisation, or a territory, such as a region, nation, or city.
It provides information that is helpful in matching the firms' resources and capabilities to the competitive environment in which it operates and is therefore an important contribution to the strategic planning process.
It should not be viewed as a static method with emphasis solely on its output, but should be used as a dynamic part of the management and business development process." [forlearn.jrc.ec.europa.eu/ guide/ 4_ methodology/ meth_ swot-analysis.htm]
This SWOT analysis matrix diagram example was created using the ConceptDraw PRO diagramming and vector drawing software extended with the SWOT Analysis solution from the Management area of ConceptDraw Solution Park.
SWOT matrix

 Management
This solution extends ConceptDraw DIAGRAM and ConceptDraw MINDMAP with Management Diagrams and Mind Maps (decision making, scheduling, thinking ideas, problem solving, business planning, company organizing, SWOT analysis, preparing and holding meetings
HelpDesk
How to Make an Ansoff Matrix Template

 Entity-Relationship Diagram (ERD)
Entity-Relationship Diagram (ERD) solution extends ConceptDraw DIAGRAM software with templates, samples and libraries of vector stencils from drawing the ER-diagrams by Chen's and crow’s foot notations.
 Cross-Functional Flowcharts
Cross-functional flowcharts are powerful and useful tool for visualizing and analyzing complex business processes which requires involvement of multiple people, teams or even departments. They let clearly represent a sequence of the process steps, the order of operations, relationships between processes and responsible functional units (such as departments or positions).
 Fishbone Diagram
Fishbone Diagrams solution extends ConceptDraw DIAGRAM software with templates, samples and library of vector stencils for drawing the Ishikawa diagrams for cause and effect analysis.
- Swot Analysis For It Company
- Swot Analysis Examples
- SWOT Analysis | New business opportunity SWOT analysis matrix ...
- SWOT Analysis | SWOT Analysis Solution - Strategy Tools | SWOT ...
- Swot Analysis Strengths, Weaknesses, Opportunities, and Threats ...
- SWOT Analysis | Swot Analysis Examples | What is SWOT Analysis ...
- Swot Analysis For A Company
- SWOT Analysis | How to Create SWOT Analysis Template in ...
- New business opportunity SWOT analysis matrix - Template portrait ...
- Swot Analysis Matrix Example
- SWOT Analysis Solution - Strategy Tools | SWOT Analysis Tool for ...
- Matrices | Ansoff's product / market matrix | SWOT matrix template ...
- Swot Analysis Strengths, Weaknesses, Opportunities, and Threats ...
- SWOT Analysis | Swot Analysis Examples | SWOT Analysis ...
- SWOT Analysis | Swot Analysis Examples | SWOT Analysis ...
- SWOT analysis for a small independent bookstore | Small business ...
- Swot Analysis Strengths, Weaknesses, Opportunities, and Threats ...
- Sample Swot Analysis Of A Company
- SWOT Analysis | Block diagram - Porter's five forces model | SWOT ...
- Remote Projects in Corporate Strategy | Swot Analysis Examples ...