Fishbone Diagram Example

Cause and Effect Diagram

Affinity Diagram

 Fishbone Diagram
Fishbone Diagrams solution extends ConceptDraw PRO software with templates, samples and library of vector stencils for drawing the Ishikawa diagrams for cause and effect analysis.
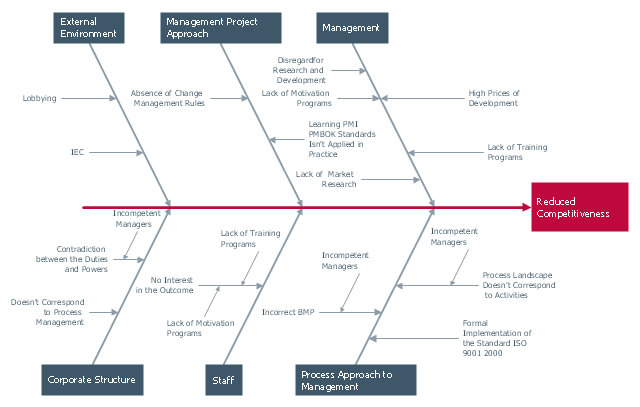
"Cause-and-effect diagrams can reveal key relationships among various variables, and the possible causes provide additional insight into process behavior.
Causes can be derived from brainstorming sessions. These groups can then be labeled as categories of the fishbone. They will typically be one of the traditional categories mentioned above but may be something unique to the application in a specific case. Causes can be traced back to root causes with the 5 Whys technique." [Ishikawa diagram. Wikipedia]
The Ishikawa diagram (cause and effect diagram, fishbone diagram) example "Factors reducing competitiveness" was created using the ConceptDraw PRO diagramming and vector drawing software extended with the Fishbone Diagrams solution from the Management area of ConceptDraw Solution Park.
Ishikawa diagram
Ishikawa Diagram

Fishbone Diagram Design Element
.png "Fishbone Diagram Design Element")
Relations Diagram

Cause and Effect Diagram Software

Cause and Effect Analysis - Fishbone Diagrams for Problem Solving

 Fishbone Diagrams
The Fishbone Diagrams solution extends ConceptDraw PRO v10 software with the ability to easily draw the Fishbone Diagrams (Ishikawa Diagrams) to clearly see the cause and effect analysis and also problem solving. The vector graphic diagrams produced using this solution can be used in whitepapers, presentations, datasheets, posters, and published technical material.
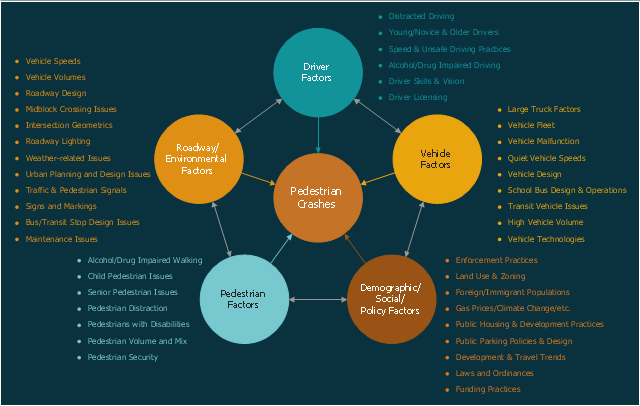
This circle-spoke diagram sample shows the factors related to pedestrian safety and morbidity. It was designed on the base of the figure 3 on the webpage "Pedestrian Safety Strategic Plan: Recommendations for Research and Product Development" from the website of the Federal Highway Administration (FHWA) of the U.S. Department of Transportation (DOT).
"Based on the data analysis and literature review, there are a wide variety of factors which contribute to the likelihood of a pedestrian crash. These include factors related to such categories as pedestrians (e.g., pedestrian age, behavior), drivers (e.g., driver distraction), vehicles (e.g., large trucks), roadway environment (e.g., vehicle speeds and volumes, roadway and intersection design), as well as demographic, social, and policy factors (e.g., land use and zoning practices). Some of the primary factors within each of these five categories are given in Figure 3."
[safety.fhwa.dot.gov/ ped_ bike/ pssp/ fhwasa10035/ ]
The hub-and-spoke diagram example "Factors related to pedestrian safety and morbidity" was created using the ConceptDraw PRO diagramming and vector drawing software extended with the Circle-Spoke Diagrams solution from the area "What is a Diagram" of ConceptDraw Solution Park.
Circle-spoke diagram
Fishbone Diagram Problem Solving

Using Fishbone Diagrams for Problem Solving

Use a Fishbone Diagram to Attack Complex Problems

- Ishikawa diagram - Factors reducing competitiveness | Fishbone ...
- Factor Tree Analysis Example
- PROBLEM ANALYSIS. Relations Diagram | PROBLEM ANALYSIS ...
- Ishikawa Diagram | Fishbone Diagram Example | Cause and Effect ...
- How To Create Root Cause Analysis Diagram Using ConceptDraw ...
- Examples For Environment On Cause And Effect Diagram
- Ishikawa Diagram | Fishbone Diagram Example | Ishikawa fishbone ...
- Fishbone Diagram Problem Solving | Fishbone Diagram Example ...
- Factors related to pedestrian safety and morbidity | Circle-Spoke ...
- Cause and Effect Analysis - Fishbone Diagrams for Problem Solving ...
- Cause and Effect Analysis - Fishbone Diagrams for Problem Solving ...
- Important Factors That Will Enhance Good Schematic Diagram
- Data Flow Diagrams | PROBLEM ANALYSIS. Identify and Structure ...
- Fishbone diagram - Template | Ishikawa diagram - Factors reducing ...
- Manufacturing 8 Ms fishbone diagram - Template | How Do ...
- Cause And Effect Diagram Examples In Healthcare
- Fishbone Diagram | Fishbone Diagram Example | Using Fishbone ...
- Fishbone Diagram Example | Using Fishbone Diagrams for Problem ...
- Venn Diagram Examples for Problem Solving. Environmental Social ...