Bar Diagrams for Problem Solving. Create economics and financial bar charts with Bar Graphs Solution
Create bar graphs for visualizing economics problem solving and financial data comparison using the ConceptDraw DIAGRAM diagramming and vector drawing software extended with the Bar Graphs Solution from the Graphs and Charts area of ConceptDraw Solition Park.Bar Diagrams for Problem Solving. Create manufacturing and economics bar charts with Bar Graphs Solution
Create bar charts for visualizing problem solving in manufacturing and economics using the ConceptDraw DIAGRAM diagramming and vector drawing software extended with the Bar Graphs Solution from the Graphs and Charts area of ConceptDraw Solition Park.Sales Growth. Bar Graphs Example
This sample was created in ConceptDraw DIAGRAM diagramming and vector drawing software using the Bar Graphs Solution from Graphs and Charts area of ConceptDraw Solution Park. It is Bar Graphs example, Sales Growth example, Column Chart Example - Sales Report.Bar Diagram Math
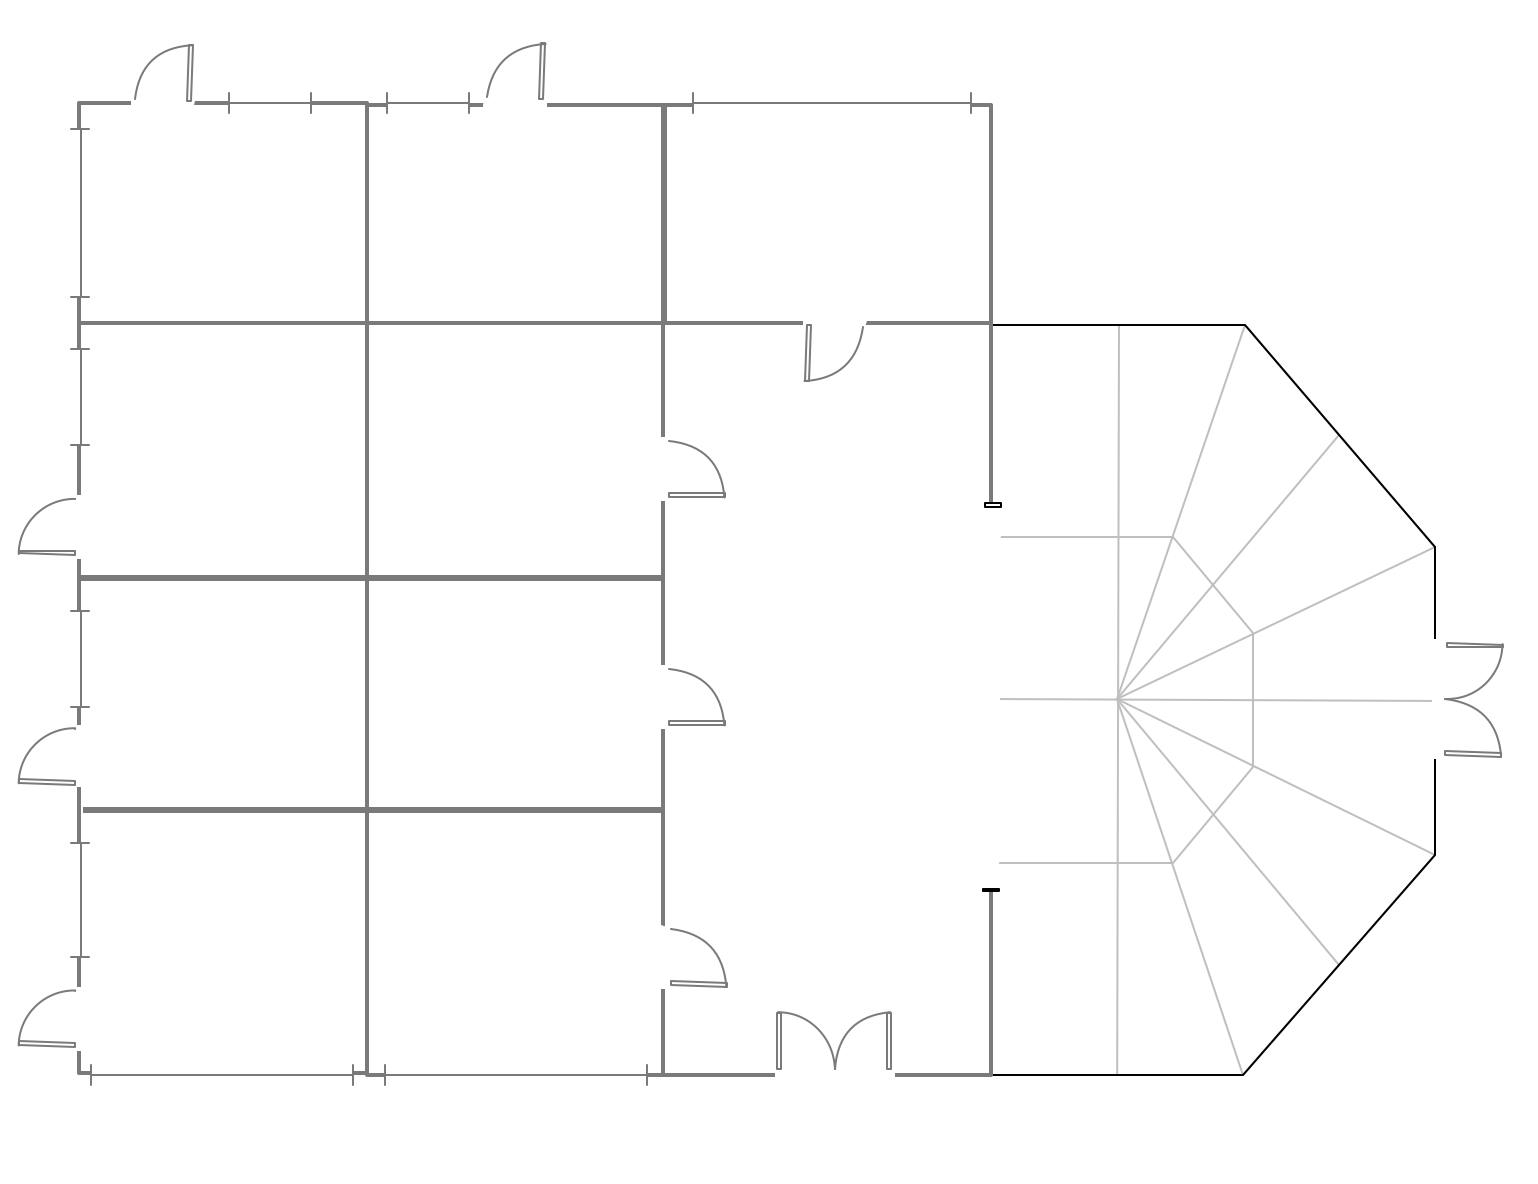
ConceptDraw DIAGRAM extended with Divided Bar Diagrams solution from Graphs and Charts area of ConceptDraw Solution Park is the best software for quick and simple drawing the Divided Bar Diagrams and Bar Diagram Math.Mini Hotel Floor Plan. Floor Plan Examples
Сonstruction of a hotel complex or a small hotel requires a separate approach to the layout of the building and its premises. It is important to consider not only the internal layout of rooms, corridors, lobby, and even service and utility rooms. Therefore, the hotel project is developed with focusing on the needs of future guests and with obligatory accounting the convenience of maintenance by personnel. The Basic Floor Plans solution and Floor Plans solution from the Building Plans area of ConceptDraw Solution Park include a lot of Hotel floor plan samples, examples, templates and vector stencils libraries with enormous quantity of ready-to-use symbols of interior design elements, as well as furniture and equipment for designing the floor plans for the hotels of different size and style, for economy and limited service hotels, bed and breakfast hotels, mini hotels, for drawing the space layout plans for medium-sized hotels and large hotel complexes, and many other plans, designs and layouts using the tools of ConceptDraw DIAGRAM diagramming and vector drawing software.Target Diagram
Target Diagram is a convenient and visual way of presentation information which is popular and widely used in marketing, business and economics. ConceptDraw DIAGRAM diagramming and vector drawing software extended with Target and Circular Diagrams solution from the Marketing area of ConceptDraw Solution Park is ideal for fast and easy drawing a Target Diagram.
 Target and Circular Diagrams
This solution extends ConceptDraw DIAGRAM software with samples, templates and library of design elements for drawing the Target and Circular Diagrams.
Flowchart Software
Flowchart is a simple diagram, map or graphical schematic representation the sequence of actions within a process. It is ideal for displaying how a process currently flows or can function ideally. The Flowcharts let define the steps and boundaries of a process, uncover problems or miscommunications. The Flowcharts are widely used in education, software development, business, economics, thanks to their visuality they are ideal for presentations, reports, for using on conferences to help the audience comprehend the content better, or easy find flaws in a process flow diagrams. ConceptDraw DIAGRAM is professional flowcharts software and feature-rich flowchart maker, which supports Mac OS X and Windows. It contains at ConceptDraw Solution Park a rich set of stencils and professional flowchart symbols for design. It lets create simply professional-looking Flowcharts based on thousand free flowchart templates, colored symbols and examples. ConceptDraw DIAGRAM is a 3 times cheaper alternative to MS Visio available for both Mac and PC. It’s is another full featured business and technical diagramming application that can easily take care of Visio files within OS X. Another bonus with ConceptDraw DIAGRAM – it's cross-platform. You can work on a document in both OS X and Windows, skipping Visio entirely.
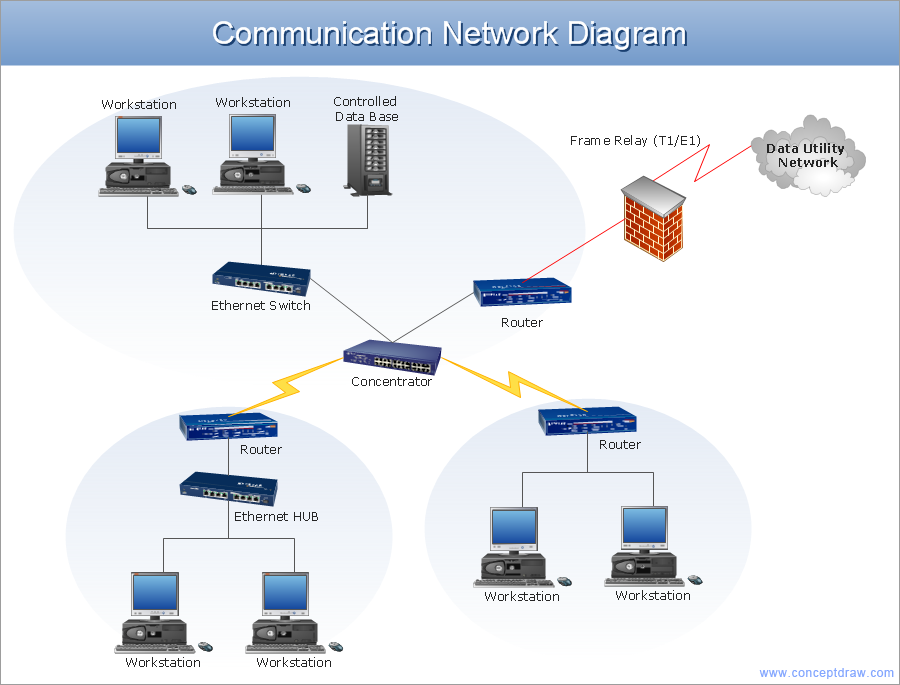
Network Architecture
Network architecture is a design of the structure of communication network. Network architecture specifies network configuration, the main physical components of the network, products and services delivered via communication network, defines the components that characterize its common logical organization, technical support, software. It describes encoding methods, principles of operation and user interface. To graphically represent the network is used a Network Architecture Diagram. ConceptDraw DIAGRAM software is the best network diagramming tool that lets create in minutes your own professional Network diagrams from numerous templates and examples. Computer & Networks solution for ConceptDraw DIAGRAM software provides extensive libraries of vector stencils for drawing Network architecture diagrams and maps, Cisco network architectural drawings, Computer communication network design blueprints, TCP/IP network architecture diagrams for LANs and WANs, Network floor plan layouts, Logical network diagrams, Network communication plans, Web-based network diagrams, etc.
Cause and Effect Diagram
ConceptDraw DIAGRAM software extended with Fishbone Diagrams solution from the Management area of ConceptDraw Solution Park is perfect for Cause and Effect Diagram creating. It gives the ability to draw fishbone diagram that identifies many possible causes for an effect or a problem. Causes and Effects are usually grouped into major categories to identify these sources of variation. Causes and Effects in the diagram show relationships among various factor. Fishbone diagram shows factors of Equipment, Process, People, Materials, Environment and Management, all affecting the overall problem.- Economic Planning Graphs
- Diagram Of Economic Planning
- Cross Functional Flowchart Examples | Venn Diagrams | Line ...
- Cycle Diagram Of Economic Planning
- Easy Diagrams On Economic Planning
- Graphs Of Economic Planning
- Tree Diagram Of Economic Planning
- Economic Planning By Chart Diagram
- Venn Diagram Of Economic Planning
- Bar Diagrams for Problem Solving. Create economics and financial ...


