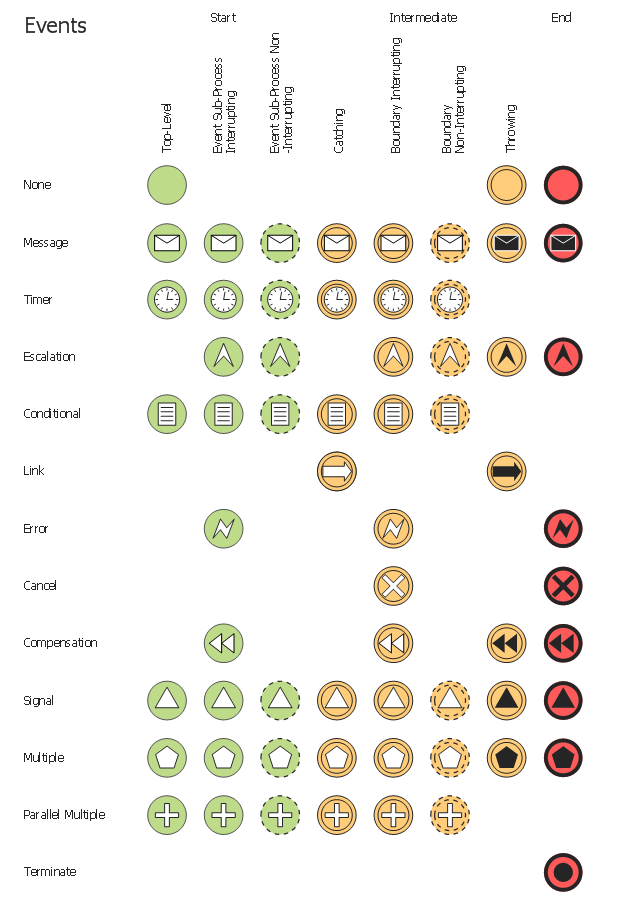
The vector stencils library "Events" contains 17 event symbols.
An Event is something that happens during the course of a business process. These events affect the flow of the process and usually have a cause or an impact. There are three types of Events, based on when they affect the flow: Start, Intermediate and End.
Use these shapes for drawing business process diagrams (BPMN 2.0) in the ConceptDraw PRO diagramming and vector drawing software extended with the Business Process Diagram solution from the Business Processes area of ConceptDraw Solution Park.
www.conceptdraw.com/ solution-park/ business-process-diagram
Message Event

Timer Event
Error Event

Escalation Event

Cancel Event
Compensation Event

Conditional Event

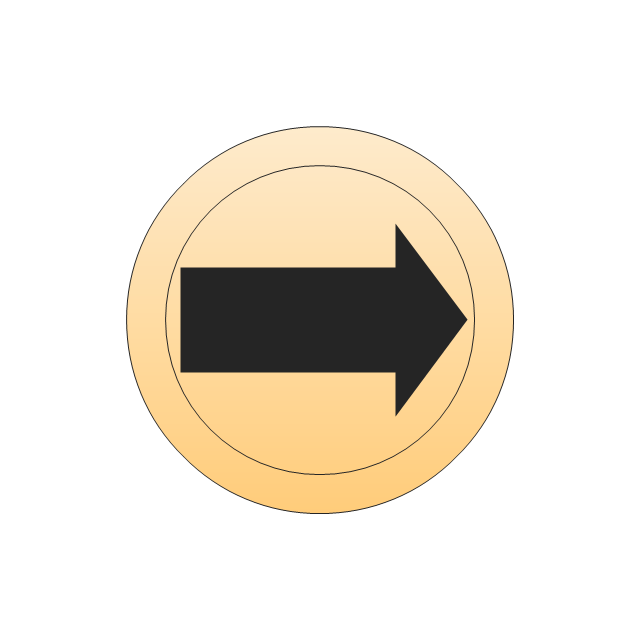
Link Event
Signal Event
Terminate Event

Multiple Event

Parallel Multiple Event

None Event - Start
None Event - Intermediate
None Event - End

Off-Page Connector - Catching

Off-Page Connector - Throwing
The vector stencils library "Events" contains 17 symbols: start, intermediate and end events and none events, message, timer, error, escalation, cancel, compensation, conditional, link, signal, terminate, multiple and parralel multiple events, off-page connectors (catching and throwing).
Use these shapes for drawing business process diagrams (BPMN 2.0) using the ConceptDraw PRO diagramming and vector drawing software.
An Event is something that happens during the course of a business process. These events affect the flow of the process and usually have a cause or an impact. There are three types of Events, based on when they affect the flow: Start, Intermediate and End.
The example "Design elements - Events BPMN 2.0" is included in the Business Process Diagram solution from the Business Processes area of ConceptDraw Solution Park.
BPMN 2.0 event symbols
This vector stencils library contains 23 events symbols for drawing business process diagrams (BPMN 1.2).
An Event is something that happens during the course of a business process. These events affect the flow of the process and usually have a cause or an impact. There are three types of Events, based on when they affect the flow: Start, Intermediate and End.
An Event is something that happens during the course of a business process. These events affect the flow of the process and usually have a cause or an impact. There are three types of Events, based on when they affect the flow: Start, Intermediate and End.
Event
Event
Event
Message
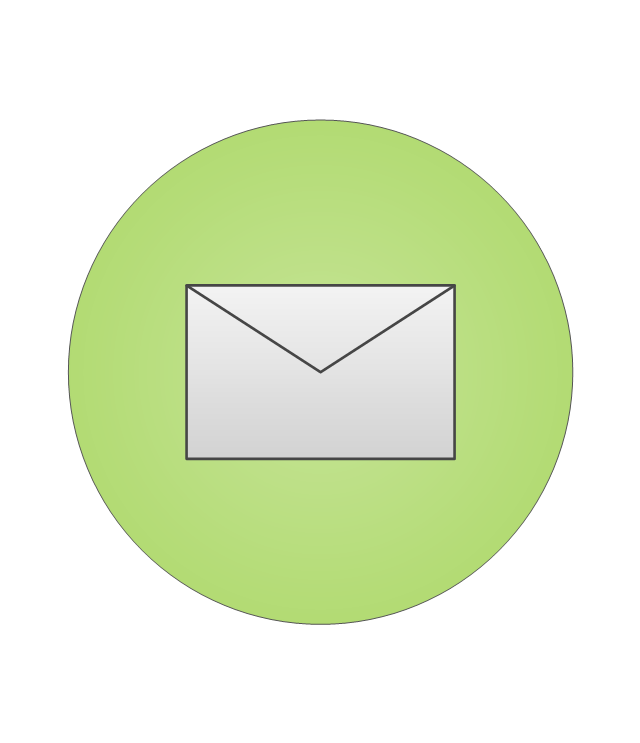
Message
Message

Timer
Timer
Error
Error

Cancel
Cancel
Compensation

Compensation

Rule
Rule
Link
Link
Link
Terminate
Multiple
Multiple
Multiple

Business Process Elements: Events
")

Process Flowchart


Creating a default presentation in ConceptDraw MINDMAP

HelpDesk
How to Create a Fault Tree Analysis Diagram (FTD) in ConceptDraw PRO

Fault Tree Analysis Software

Business Process Modeling with ConceptDraw

How Do Fishbone Diagrams Solve Manufacturing Problems

Crea Diagramas De Flujo

Process Flowchart Symbols

BPMN 2.0

How to Use the ″Online Store PR Campaign″ Sample

How to create your UML Diagram

- Events - Vector stencils library | Design elements - Events BPMN 2.0 ...
- Events BPMN 1.2 - Vector stencils library | Design elements - Events ...
- Events BPMN 1.2 - Vector stencils library
- Design elements - Events BPMN 2.0 | Events - Vector stencils library ...
- Events - Vector stencils library | Events - Vector stencils library ...
- Escalation Event
- Events - Vector stencils library
- Events - Vector stencils library | People pictograms - Vector stencils ...
- Bpmn 2 0 Event Symbols
- Design elements - Events BPMN 2.0
- Basic Flowchart Symbols and Meaning | Design elements - Events ...
- Bpmn Events
- Bpmn Parallel Multiple Event Examples
- Bpmn 2 Event
- Business process model diagram BPMN 1.2 - Template | Design ...
- Events In Bpmn Process
- Activities BPMN 1.2 - Vector stencils library | Design elements ...
- Design elements - Events BPMN 2.0 | Business Process Elements ...
- Design elements - Events BPMN 1.2
- Design elements - Events BPMN 2.0 | BPMN 2.0 | Business Process ...