ConceptDraw PRO ER Diagram Tool
Entity-relationship model, also called ER-model, is the main tool of domain modeling on the stage of conceptual design. The modeling of domain data structures is based on the use of graphical tools - Entity-Relationship diagrams (ER-diagrams). The core concepts of ER-Diagram are entity, attribute and relationship. ER-diagram lets visually represent the entities, helps effectively document all properties of designed system and to detail the data storages. To represent the elements at ER-model are commonly used Chen’s notation and Crow’s foot notation, each has its pros and cons. The entity on ER-diagram is represented in the form of rectangle, which specifies its name. An attribute is a property of the entity and relationship is an interaction between the entities. The relationship between two entities is called binary, between more than two entities - ternary. Specific software, such as ConceptDraw PRO with Entity-Relationship Diagram (ERD) solution from ConceptDraw Solution Park is helpful for easy creation Entity-Relationship Diagrams.ConceptDraw PRO ER Diagram Tool
Entity-relationship model, also called ER-model, is the main tool of domain modeling on the stage of conceptual design. The modeling of domain data structures is based on the use of graphical tools - Entity-Relationship diagrams (ER-diagrams). The core concepts of ER-Diagram are entity, attribute and relationship. ER-diagram lets visually represent the entities, helps effectively document all properties of designed system and to detail the data storages. To represent the elements at ER-model are commonly used Chen’s notation and Crow’s foot notation, each has its pros and cons. The entity on ER-diagram is represented in the form of rectangle, which specifies its name. An attribute is a property of the entity and relationship is an interaction between the entities. The relationship between two entities is called binary, between more than two entities - ternary. Specific software, such as ConceptDraw PRO with Entity-Relationship Diagram (ERD) solution from ConceptDraw Solution Park is helpful for easy creation Entity-Relationship Diagrams.Process Flowchart
The main reason of using Process Flowchart or PFD is to show relations between major parts of the system. Process Flowcharts are used in process engineering and chemical industry where there is a requirement of depicting relationships between major components only and not include minor parts. Process Flowcharts for single unit or multiple units differ in their structure and implementation. ConceptDraw PRO is Professional business process mapping software for making Process flowcharts, Process flow diagram, Workflow diagram, flowcharts and technical illustrations for business documents and also comprehensive visio for mac application. Easier define and document basic work and data flows, financial, production and quality management processes to increase efficiency of your business with ConcepDraw PRO. Business process mapping software with Flowchart Maker ConceptDraw PRO includes extensive drawing tools, rich examples and templates, process flowchart symbols and shape libraries, smart connectors that allow you create the flowcharts of complex processes, process flow diagrams, procedures and information exchange. Process Flowchart Solution is project management workflow tools which is part ConceptDraw Project marketing project management software. Drawing charts, diagrams, and network layouts has long been the monopoly of Microsoft Visio, making Mac users to struggle when needing such visio alternative like visio for mac, it requires only to view features, make a minor edit to, or print a diagram or chart. Thankfully to MS Visio alternative like ConceptDraw PRO software, this is cross-platform charting and business process management tool, now visio alternative for making sort of visio diagram is not a problem anymore however many people still name it business process visio tools.
Network Diagram Software Physical Network Diagram
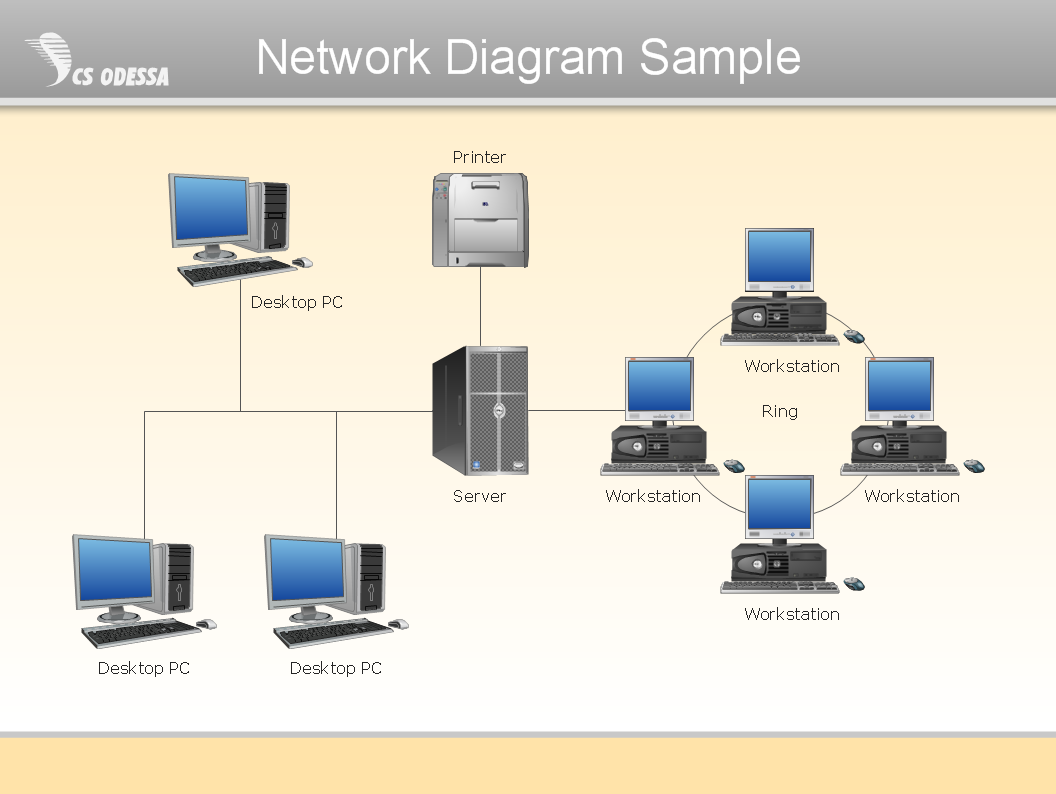
ConceptDraw Network Diagram Software is ideal for network engineers and network designers who need to draw Physical Network Diagrams.
UML Diagram
The accepted open standard that is used in software engineering and system design, when modeling object-oriented systems and business processes is known as Unified Modeling Language (UML). UML was created for definition, visualization, design and documentation software systems. It isn't a programming language, but on the base of UML model can be generated code. UML uses generic set of graphic notations for creation an abstract model of the system called UML-model. The UML notation lets visually represent requirements, subsystems, structural and behavioral patterns, logical and physical elements, etc. UML defines 13 types of diagrams: Class (Package), Use Case, Sequence, Object, Collaboration, Component, Timing, Interaction Overview, State Machine, Composite Structure, Activity, and Deployment. All these types of UML Diagrams can be fast and easy created with powerful ConceptDraw PRO software extended with special Rapid UML solution from Software Development area of ConceptDraw Solution Park.Workflow Diagram Examples
ConceptDraw PRO software extended with the Workflow Diagram solution provides a complete set of samples, templates and features help you to draw diagrams faster. A workflow diagram software you use for drawing workflow diagrams and business process flow diagrams should provide a wide set of examples allows you get closer with workflow diagrams, learn symbols meaning, find appropriate layout and design, and then start drawing your own workflow diagram masterfully. Workflow diagrams used for orchestrating organizational processes between company departments and humans, so critical process diagrams used to train many people to interact must be clear and professional to convey an idea from a view. Thats a reason we created a lot workflow symbols and workflow icons collected them into special Workflow Diagram solution in ConceptDraw Solution Park.Data Flow Diagram
Data Flow Diagram (DFD) is the part of the Structured Systems Analysis and Design Methodology (SSADM), which is intended for information systems projection and analysis. Data Flow Diagrams allow graphically represent the data flows in information system and analyze the data processing during the structural projection. This type of diagrams lets visually show a work of information system and results of this work, it is often used in connection with human processes and can be displayed as Workflow diagram. Data Flow Diagram visualizes processes and functions, external entities, data depositories, and data flows connecting these elements and indicating direction and data character. Each of these elements used for DFD has its own graphical notation. There are two notations to draw DFDs - Yourdon & Coad and Gane & Sarson. ConceptDraw PRO extended with Data Flow Diagrams (DFD) solution from Software Developmant area is ideal for designing professional looking DFDs, which can be then easily exported in various formats.Business Diagram Software
When managing the projects, people, or networks, there are daily designed and used different types of Business diagrams, so the powerful drawing software will be very useful for this. ConceptDraw PRO with large quantity of business solutions will meet your needs and will help you convey your ideas successful and rapidly, no matter are you professional or beginner. It is the best choice for business specialists and technical professionals who need quickly and easily explore, visualize, and communicate information. ConceptDraw PRO business diagram software is the most powerful business software and relational charting software. Create advanced, completely customizable Business Process Diagrams, Business Flow Charts, Work Flow Diagrams, Organizational Charts, Audit diagrams, Marketing diagrams, Value Stream Maps, TQM diagrams, ERD diagrams, EPC diagrams, Cause and Effect diagrams, Infographics, Dashboards, and other Relational business diagrams from your data using the powerful drawing tools of ConceptDraw Solution Park.
Communication Diagram UML2.0 / Collaboration UML1.x
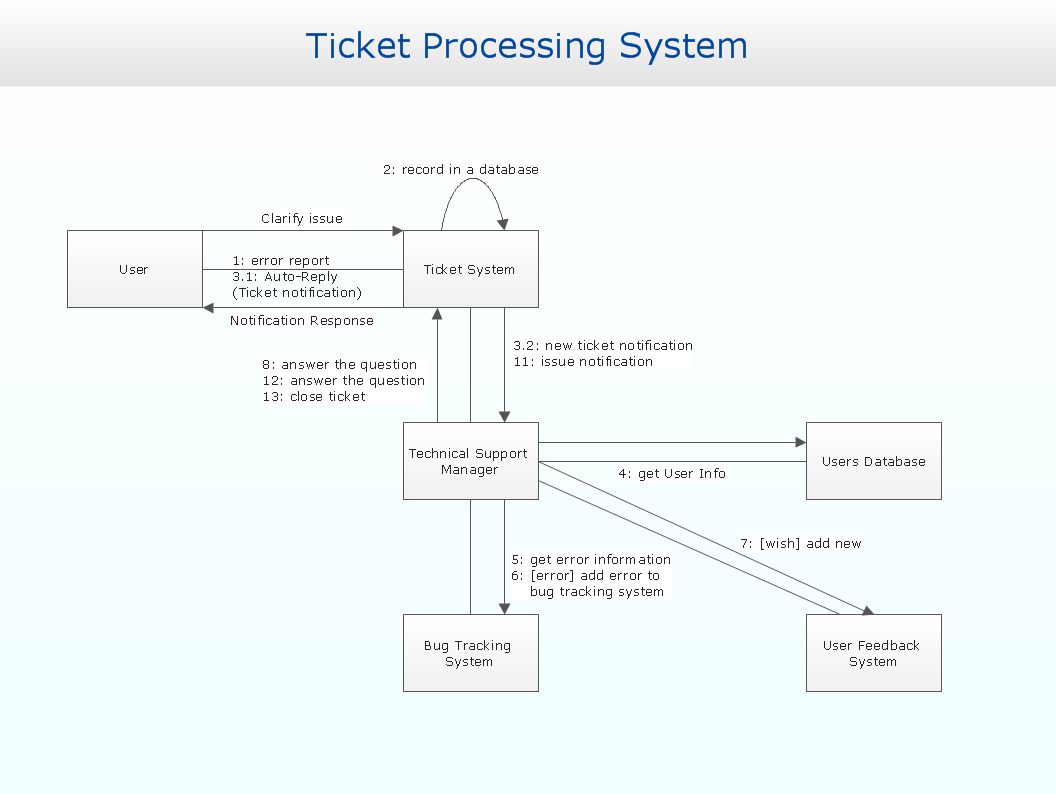
UML Communication diagramming software with rich examples and template. ConceptDraw is ideal for software designers and software developers who need to draw UML Communication Diagrams.
Horizontal Orgchart
The Organizational Chart is a diagram that shows the structure of the organization and the relationships of its parts. There are many ways to present the Organizational Chart. One of them is the Horizontal Organizational Chart: the parts of the diagram are arranged from left to right, or from right to left. This sample was created in ConceptDraw PRO diagramming and vector drawing software using the Organizational Charts Solution from the Management area of ConceptDraw Solution Park.- Draw Er Diagram For An Account Is A Relationship Between A
- Er Diagram For Customer Branch And Account Relationship
- Ternary Crowfoot
- Draw An ER Diagram For Costumer Branch And Account Relationship
- Customer Branch Er Model
- Uml Diagram Between Customer And Bank
- UML use case diagram - Banking system | Entity-Relationship ...
- ATM UML Diagrams | UML use case diagram - Banking system ...
- ATM UML Diagrams | ConceptDraw Solution Park | Accounting ...
- UML use case diagram - Banking system | Fishbone Diagram | Data ...


