Made with
ConceptDraw
DIAGRAM 18

ConceptDraw DIAGRAM ER Diagram Tool

The main tool of domain modeling at the stage of conceptual design is the Entity-relationship model, also called ER-model. Modeling domain data structures is based on the usage of graphical tools — ER-diagrams (Entity-Relationship diagrams). Simply put, it is a visual representation of relationships between entities.

The core concepts of ER Diagram are entity, attribute and relationship. An entity is an object of the real world that can exist independently. An entity has instances which differ in attribute values and allow unambiguous identification. An attribute is a property of the essence. For example, the entity named Book is characterized by attributes such as author, title, price, publishing house, edition, number of pages. Specific books are instances of the book entity. These instances vary in the values of these attributes and are uniquely identified by the attribute "name". Attribute that uniquely identifies the instance of the entity is called the primary key. It may also be a composite key, which is a combination of several attributes.

A very important feature of the entity-relationship model is that it can be represented as a graphical diagram. This greatly facilitates the subject area analysis. There are several notations used to represent entity-relationship elements, like Crow’s foot notation, or Chen notation, and each has its pros and cons.

ConceptDraw DIAGRAM ER Diagram Tool *

Example 1. ER Diagram

The entity on the ER-diagram is represented in the form of a rectangle, which indicates its name. Relationship is the interaction between entities, which is characterized by degree which counts how many entities are involved in the relation. The relationship between the two entities is called binary, and the relationship between more than two entities is ternary. Attributes, entities and relationships are connected by straight lines. Relation is shown in the form of a diamond. When creating a diagram, you can follow a few obvious steps. First, you need to identify entities and relationships among them. The following step is to identify the semantic information in the sets of relations (for example, whether a certain set of connections is a 1:n relation). Then you should define relationships cardinalities and determine attributes and their values sets. The final step is to organize the data in the form of entity-relationship connections.

As an example, let’s imagine a database designed for storing information about some bank activities. The bank has affiliates, which are controlled by managers. Customers of the bank have different types of accounts — current, term, demand, deposit, card account. Branches handle these accounts. The described domain will be called Bank. Let’s determine four entities: the Affiliate, the Manager, the Account, the Customer and some relations among them: the Manager controls the Affiliate; the Affiliate handles the Account; the Customer has the Account.

ConceptDraw PRO v5 with Entity-Relationship Diagram (ERD) solution serving as ERD software allows you to visually create Entity Relationship diagrams (ERDs) for various database systems, it supports ODBC-compatible databases (Oracle, MS SQL, InterBase, MySQL, MS Access, Firebird and others). The built-in scripting language allows to connect to ODBC-compatible databases and automatically generate the structure of a database (reverse engineering of the database structure).
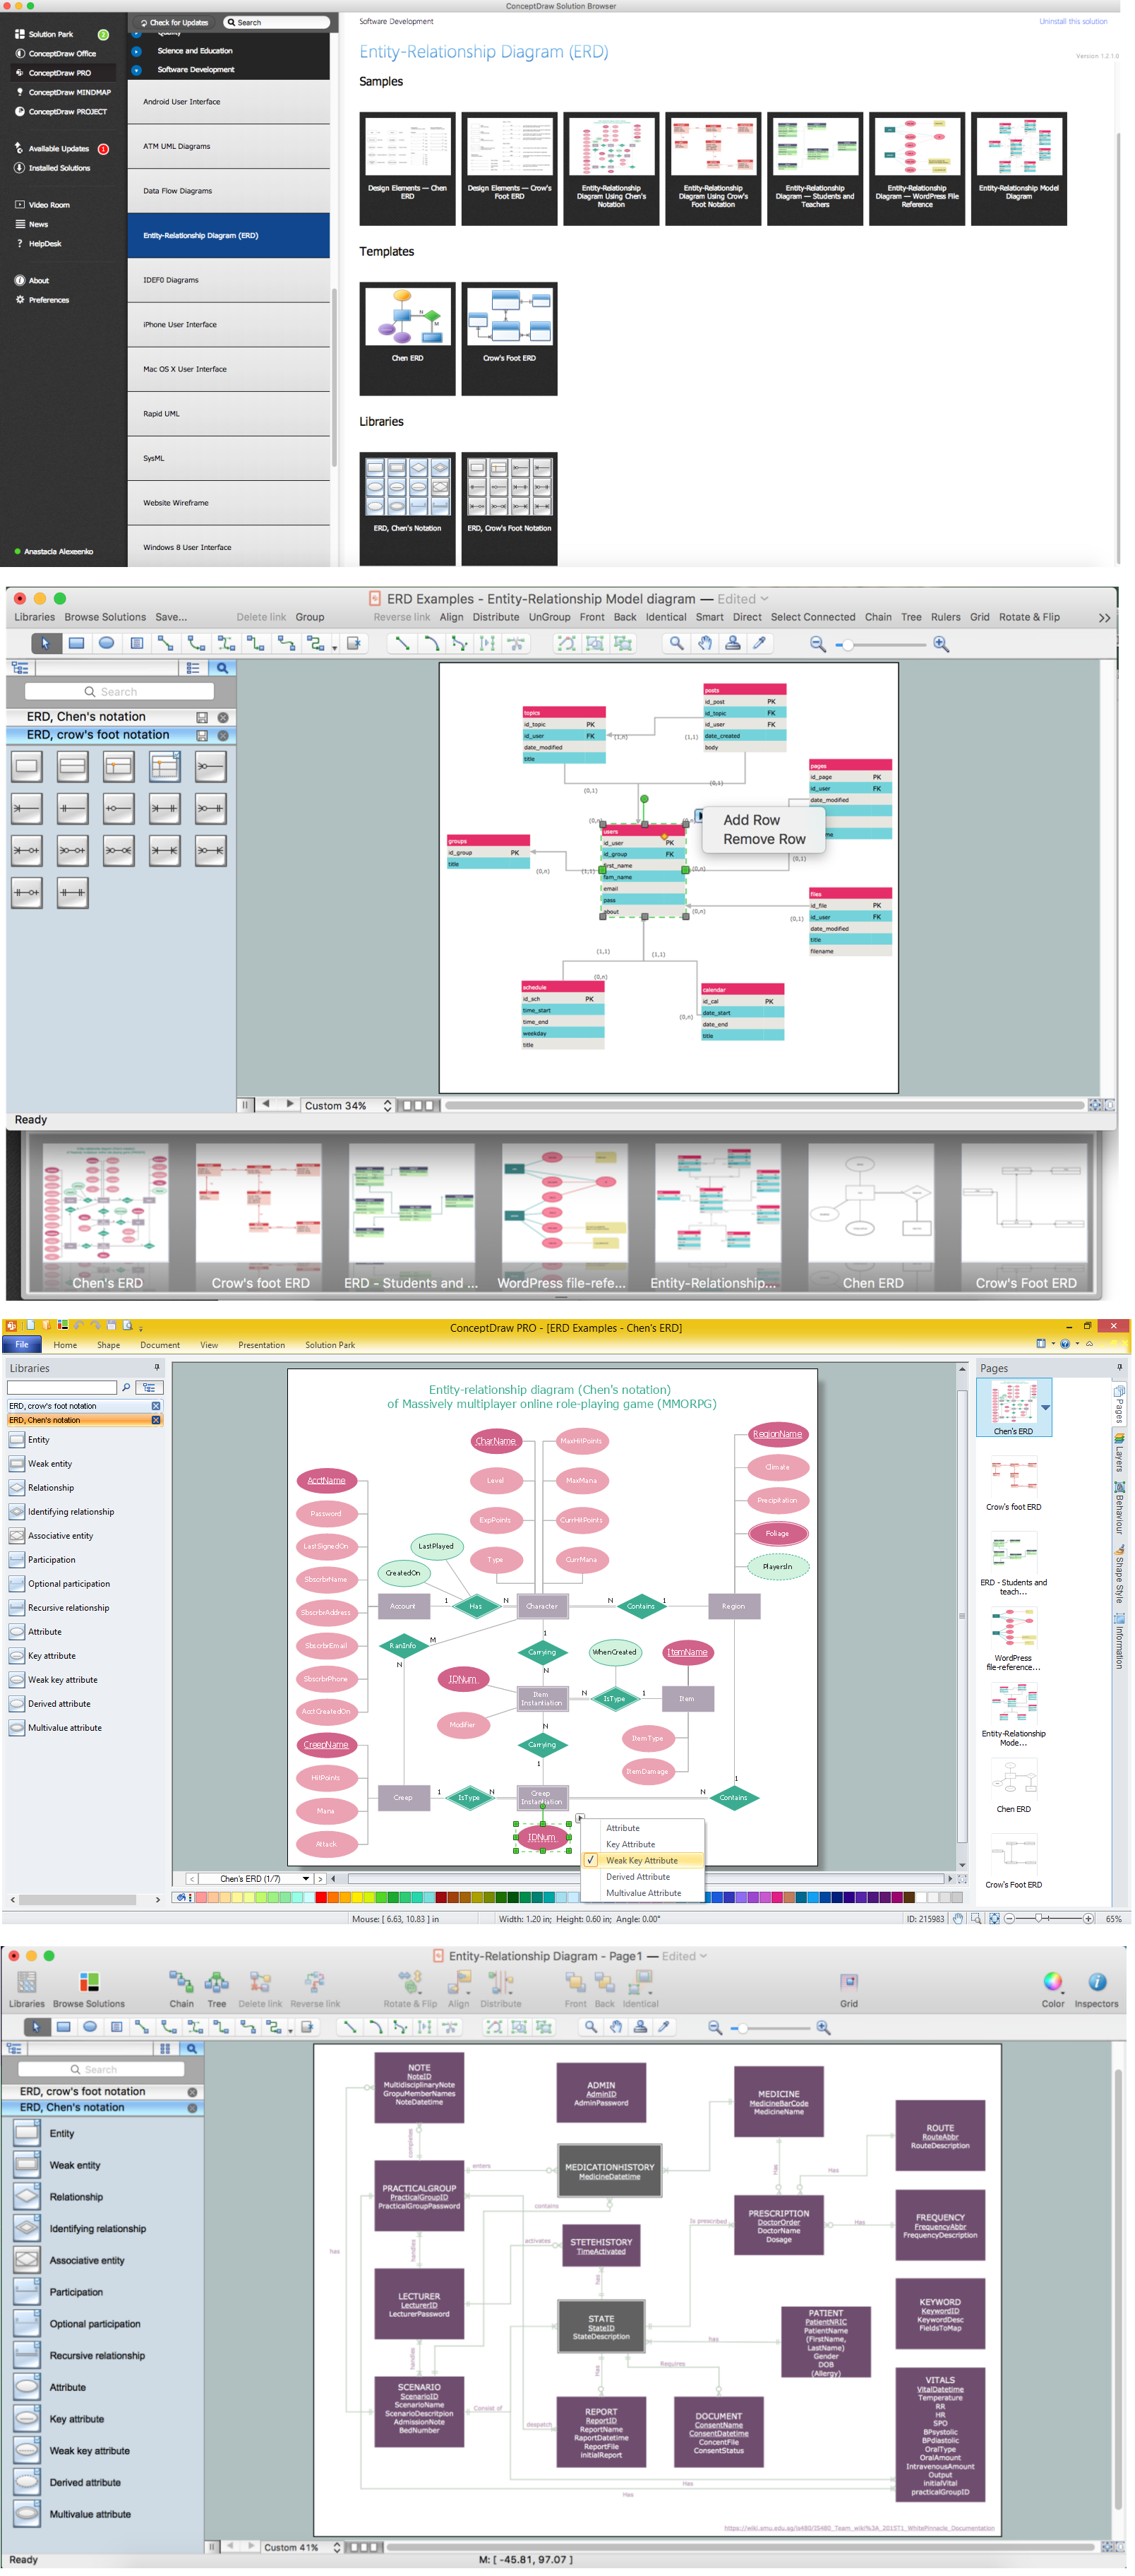
ConceptDraw DIAGRAM  ER Diagram Tool

Example 2. ConceptDraw ER Diagram Tool

ConceptDraw ER Diagram Tool works across any platform, meaning you never have to worry about compatibility again. ConceptDraw PRO v5 allows you to make Entity-Relationship Diagram (ERD) on PC or macOS operating systems.

When creating an ERD our ERD software considers individual database options such as referential integrity, constraints, domains, triggers, stored procedures, functions, packages, views, sequences, synonyms etc.

ConceptDraw PRO v5 is a very easy-to-use and intuitive database design tool and ER Diagram tool which can save you hundreds hours of work. Entity-Relationship Diagram (ERD) solution contains 2 libraries with 45 predesigned vector graphic elements, collection of professional ERD samples, examples and templates.

ConceptDraw PRO v5 is excellent choice of database designers for modeling, reverse and forward engineering of relational databases. It is not only an excellent tool for ER Diagram, but also the one that allows you to reverse engineer already existing database structures, create detailed HTML, PDF or PPT reports.
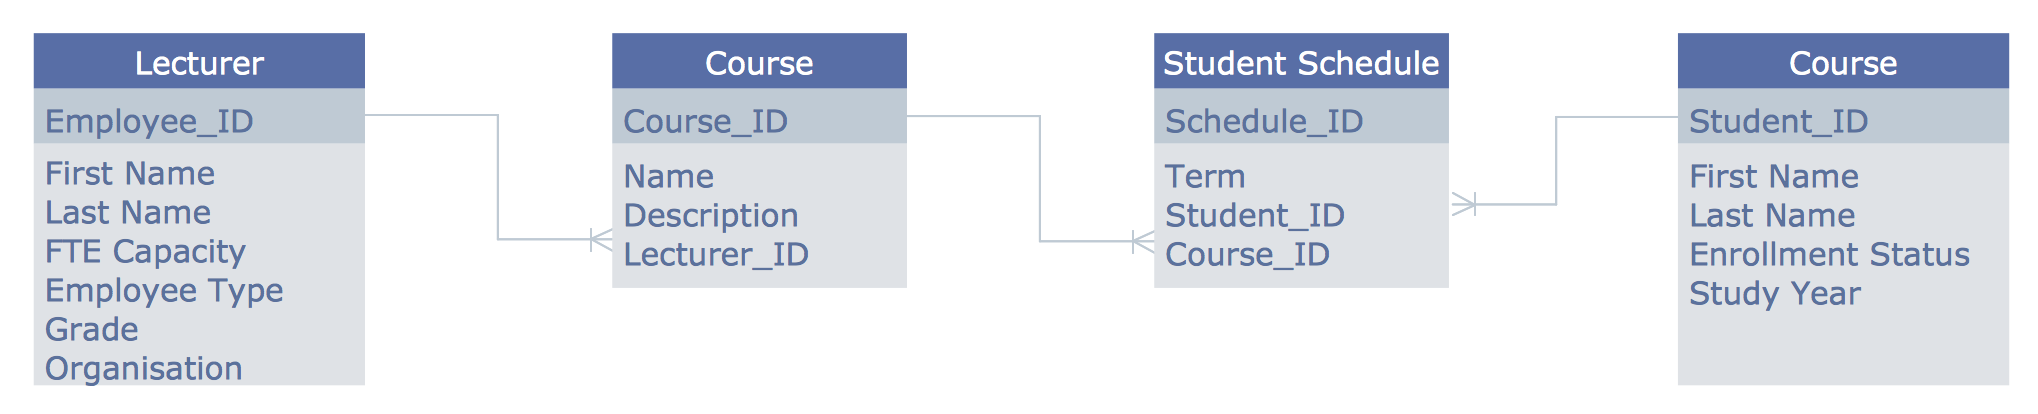
ER Diagram (ERD)

Example 3. ER Diagram (ERD)

The ER Diagram samples you see on this page were created in ConceptDraw PRO v5 using the Entity-Relationship Diagram (ERD) Solution. They successfully demonstrate solution's capabilities and professional results you can achieve. An experienced user spent 10 minutes creating every of these samples.

Use the Entity-Relationship Diagram (ERD) Solution for ConceptDraw PRO v5 software to create your own professional looking ER Diagrams quick, easy and effective, and then successfully use them in your scientific or education activity.

All source documents are vector graphic documents. They are available for reviewing, modifying, or converting to a variety of formats (PDF file, MS PowerPoint, MS Visio, and many other graphic formats).


TEN RELATED HOW TO's:
How to use mind map for developing scripts. An easy way to arrange information using Evernote and mind map. Making daily plan become more convenient with this integration.Develop Scripts Exchanging Mind Maps with Evernote *
Picture: Develop Scripts Exchanging Mind Maps with Evernote
Related Solution:
The Total Quality Management Diagram solution helps your organization visualize business and industrial processes. Create Total Quality Management diagrams for business process with ConceptDraw software.Identifying Quality Management System *
Picture: Identifying Quality Management System
Related Solution:
Flow chart is a diagrammatic representation of an algorithm and essential part of planning the system. Flow charts are widely used in technical analysis and programming for easy writing programs and explaining them to others. So, one of the most popular type of flow charts is Technical Flow Chart. Technical Flow Chart can be drawn by pencil on the paper, but it will be easier to use for designing a special software. ConceptDraw DIAGRAM diagramming and vector drawing software extended with Flowcharts Solution from the Diagrams Area of ConceptDraw Solution Park will be useful for this goal.Technical Flow Chart *
Picture: Technical Flow Chart
Related Solution:
The vector stencils library Crow's Foot Notation from the solution Entity-Relationship Diagrams (ERD) contains specific symbols of the Crow's foot notation such as relationship symbols and entity symbols for ConceptDraw DIAGRAM software.Martin ERD Diagram
Picture: Martin ERD Diagrams
Related Solution:
This sample is a UML Class Diagram that shows the banking system. The classes represented as boxes with attributes and are connected with dependency and synchronous message associations. The associations are indicated with the multiplicity 1..*. This sample can be used by the banks, by financial enterprises.Create UML Diagram *
Picture: Create UML Diagram
Related Solution:
Database structures are usually described by ER-diagrams which represents entities as boxes with lines-connections between them. You can create any entity-relationship diagram (ERD) by means of ConceptDraw DIAGRAM using ready-to-use templates and special libraries containing all the needed symbols and shapes. Creating a model for your database from now on can take just a few minutes. ERD (entity relationship diagram) designed to show the logical structure of databases. It intended to depict the relationships between data components (entities). ERDs are a popular tool for software engineers and architects. Using ERD they can manage the every aspect of database design. Also ERD can be used as guidelines for testing and communications before software release. This diagram represents the file reference system of the WordPress web platform. Because entity relationship diagrams have such a broad application area through the prevalence of database technology, it can be applied for a wide range of users.Entity-Relationship Diagram (ERD) <br>with ConceptDraw DIAGRAM  *
Picture: Entity-Relationship Diagram (ERD) with ConceptDraw DIAGRAM
Related Solution:
There are many tools to manage a process or to illustrate an algorithm or a workflow. Flowcharting is one of those tools. However, it may be difficult to show complex processes that require multiple attributes or several people in a simple flowchart, so a cross-functional flowchart would be a solution for that situation. To create such flowchart, group processes and steps to labeled rows or columns, and divide those groups with horizontal or vertical parallel lines. It is worth mentioning that there are different types of cross-functional flowcharts, like opportunity or deployment flowchart. This diagram shows a cross-functional flowchart that was made for a trading process. It contains 14 processes, distributed through 5 lines depicting the participants who interact with the process. Also there are connectors that show the data flow of information between processes. The cross-functional flowchart displays a detailed model of the trading process, as well as all participants in the process and how they interact with each other. The lines in the flowchart indicates the position, department and role of the trading process participants.Cross-Functional Flowchart
Picture: Cross-Functional Flowchart
Related Solution:
Visual information is easier to perceive. You can teach even a child to make diagrams with a good flowchart example that would be interesting for it. Flowcharts can be fun, it’s not about business processes or programming algorithms. This flowchart shows step by step process of manufacturing of Nixtamal The product which is obtained by processing maize with calcium hydroxide. We must assume that the Aztecs were very fond of this product, if the recipe of its production came to our times. This flow chart was designed using ConceptDraw DIAGRAM with its solution for designing flowcharts of various types, sizes and purposes. ConceptDraw Flowcharts solution consists from the library of flowchart symbols, containing the set vector objects. Also there are a lot of diverse templates and samples of flow charts.Flowchart Examples and Templates for ConceptDraw DIAGRAM
Picture: Flowchart Examples and Templates
Related Solution:
Sometimes, it's not easy to fit everything you need into your premise. So, you can discover how to use building plan examples and get inspired from viewing them. You can find a lot of office layout and floor plans templates in the ConceptDraw Solution Park. This drawing shows the sample of interior design of a middle-size restaurant. It was designed with a help of ConceptDraw Cafe and Restaurant Plans solution. Extensive libraries of vector objects of the interior element enabled us to design this example quickly and with no efforts. You can use this interior plan as a template while designing an interior for your own restaurant. It will help you to compose and organize elements of the interior, to bring a balance between free space and furniture in your establishment. It can be applied to organize and arrange the furniture, equipment and decorative elements in the restaurant interior and achieve balance between furniture and free space.How To use Building Plan Examples *
Picture: How To use Building Plan Examples
Related Solution:
Data modelling will help you to study and analyze business processes in your organization for optimization and increase of effectiveness and production.Data modeling with ConceptDraw DIAGRAM  *
Picture: Data modeling with ConceptDraw DIAGRAM
ConceptDraw
DIAGRAM 18