The vector stencils library "EPC diagrams" contains 23 symbol icons.
Use it to draw the event-driven process chain (EPC) flowcharts for business process modeling (BPM).
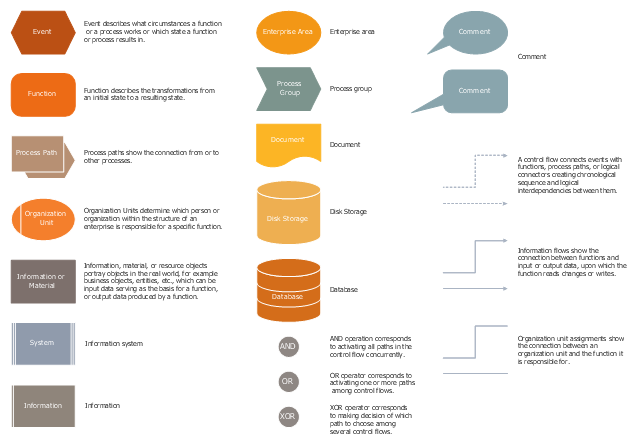
"... the elements used in Event-driven Process Chain diagram... :
(1) Event.
(2) Function.
(3) Process Owner.
(4) Organization unit.
(5) Information, material, or resource object.
(6) Logical connector.
(7) Logical relationships: Branch / Merge, Fork / Join, OR.
(8) Control flow.
(9) Information flow.
(10) Organization unit assignment.
(11) Process path. " [Event-driven process chain. Wikipedia]
The EPC symbols example "Design elements - EPC diagram" was created using the ConceptDraw PRO diagramming and vector drawing software extended with the Event-driven Process Chain Diagrams solution from the Business Processes area of ConceptDraw Solution Park.
Use it to draw the event-driven process chain (EPC) flowcharts for business process modeling (BPM).
"... the elements used in Event-driven Process Chain diagram... :
(1) Event.
(2) Function.
(3) Process Owner.
(4) Organization unit.
(5) Information, material, or resource object.
(6) Logical connector.
(7) Logical relationships: Branch / Merge, Fork / Join, OR.
(8) Control flow.
(9) Information flow.
(10) Organization unit assignment.
(11) Process path. " [Event-driven process chain. Wikipedia]
The EPC symbols example "Design elements - EPC diagram" was created using the ConceptDraw PRO diagramming and vector drawing software extended with the Event-driven Process Chain Diagrams solution from the Business Processes area of ConceptDraw Solution Park.
EPC diagram symbols
Cisco Products Additional. Cisco icons, shapes, stencils and symbols
")
Anyone Have an ERD Symbols Quick Reference?

Types of Flowcharts


Electrical Symbols — Power Sources

Process Flowchart


BPMN 2.0

How To Create Onion Diagram

 Computer Network Diagrams
Computer Network Diagrams solution extends ConceptDraw PRO software with samples, templates and libraries of vector icons and objects of computer network devices and network components to help you create professional-looking Computer Network Diagrams, to plan simple home networks and complex computer network configurations for large buildings, to represent their schemes in a comprehensible graphical view, to document computer networks configurations, to depict the interactions between network's components, the used protocols and topologies, to represent physical and logical network structures, to compare visually different topologies and to depict their combinations, to represent in details the network structure with help of schemes, to study and analyze the network configurations, to communicate effectively to engineers, stakeholders and end-users, to track network working and troubleshoot, if necessary.
 Telecommunication Network Diagrams
Telecommunication Network Diagrams solution extends ConceptDraw PRO software with samples, templates, and great collection of vector stencils to help the specialists in a field of networks and telecommunications, as well as other users to create Computer systems networking and Telecommunication network diagrams for various fields, to organize the work of call centers, to design the GPRS networks and GPS navigational systems, mobile, satellite and hybrid communication networks, to construct the mobile TV networks and wireless broadband networks.
 ConceptDraw Solution Park
ConceptDraw Solution Park collects graphic extensions, examples and learning materials
Business Graphics Software
 Cisco Network Diagrams
Cisco Network Diagrams solution extends ConceptDraw PRO with the best characteristics of network diagramming software. Included samples, templates and libraries of built-in standardized vector Cisco network icons and Cisco symbols of computers, network devices, network appliances and other Cisco network equipment will help network engineers, network designers, network and system administrators, as well as other IT professionals and corporate IT departments to diagram efficiently the network infrastructure, to visualize computer networks topologies, to design Cisco computer networks, and to create professional-looking Cisco Computer network diagrams, Cisco network designs and schematics, Network maps, and Network topology diagrams in minutes.
 Stakeholder Onion Diagrams
The Stakeholder Onion Diagram is often used as a way to view the relationships of stakeholders to a project goal. A basic Onion Diagram contains a rich information. It shows significance of stakeholders that will have has influence to the success achieve
 iPhone User Interface
iPhone User Interface solution extends ConceptDraw PRO v10 software with templates, samples and libraries with large quantity of vector stencils of graphical user interface elements, Apps icons, UI patterns for designing and prototyping of the iOS applic
- Epc Diagram
- Basic Flowchart Symbols and Meaning | Process Flow Diagram ...
- Graphical Symbols to use in EPC diagrams | Cisco Switches and ...
- Graphical Symbols to use in EPC diagrams | EPC | EPC IT Solutions ...
- Epc Diagrams Elements
- Graphical Symbols to use in EPC diagrams | Physics Diagrams ...
- Design elements - Presentation symbols | Event-driven Process ...
- The Building Blocks Used in EPC Diagrams | Design elements ...
- Event-driven process chain ( EPC ) diagram | Cross Functional ...
- How to Draw EPC Diagram Quickly | Network Diagram Software ...
- Process Flowchart | Flowchart Definition | Graphical Symbols to use ...
- Design elements - EPC diagram | Project management life cycle ...
- Physics Symbols | Graphical Symbols to use in EPC diagrams ...
- EPC diagrams - Vector stencils library | EPC diagrams - Vector ...
- Process Flowchart | Graphical Symbols to use in EPC diagrams ...
- Entity Relationship Diagram Symbols | Basic Flowchart Symbols and ...
- Business process Flow Chart - Event-Driven Process chain ( EPC ...
- Business process Flow Chart - Event-Driven Process chain ( EPC ...
- Network Diagramming Software for Design Cisco Network Diagrams ...