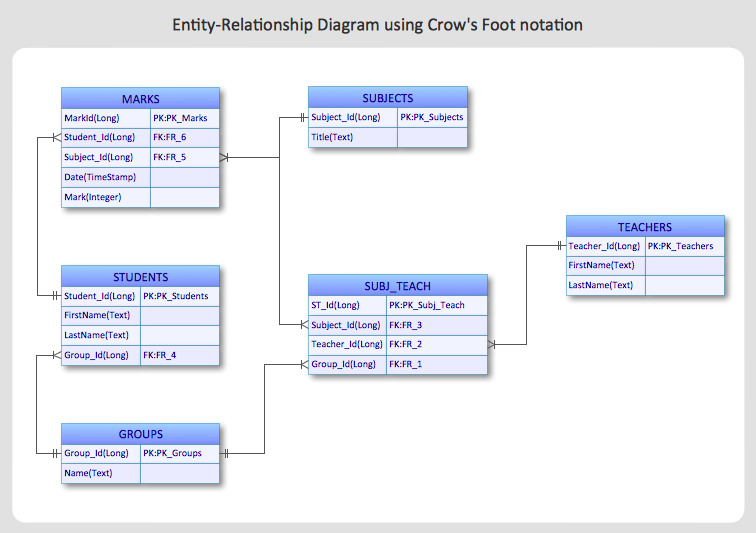
 Entity-Relationship Diagram (ERD)
An Entity-Relationship Diagram (ERD) is a visual presentation of entities and relationships. That type of diagrams is often used in the semi-structured or unstructured data in databases and information systems. At first glance ERD is similar to a flowch
Data modeling with ConceptDraw PRO
Data modelling will help you to study and analyze business processes in your organization for optimization and increase of effectiveness and production.HelpDesk
How to Create an Entity-Relationship Diagram Using ConceptDraw Solution Park
An entity-relationship diagram (ERD)is used in a database modeling process. ERD diagram shows a graphical representation of objects or concepts within an information system and their relationships.The ability to describe a database using the Entity-Relationship model is delivered by the ConceptDraw ERD solution.HelpDesk
How to Create an ERD Diagram
ERD (entity relationship diagram) is used to show the logical structure of databases. It represents the interrelationships between components of database (entities). Entity relationship diagrams are a widely used in software engineering. Using ERD software engineers can control the every aspect of database development. ER diagram can be used as guide for testing and communicating before the release of software product. ERD displays data as entities that are connected with connections that show the relationships between entities. There is some ERD notations used by data bases developers for representing the relationships between the data objects. ConceptDraw PRO and its ERD solution allow you to build ERD diagram of any notation.Data structure diagram with ConceptDraw PRO
Data structure diagram (DSD) is intended for description of conceptual models of data (concepts and connections between them) in the graphic format for more obviousness. Data structure diagram includes entities description, connections between them and obligatory conditions and requirements which connect them. Create Data structure diagram with ConceptDraw PRO.HelpDesk
Accounting Information Systems Flowchart Symbols
Accounting Information system is a combination of software and hardware, as well as organizational support. Information system - it is not only the software and computers with network equipment, but also a list of instructions and standards which can be notated using Accounting information systems flowchart symbols. All information systems can be divided into information retrieval and data processing systems. Data Flow model is a hierarchical model. Each process can be divided into structural components, that depict by corresponding flowchart symbols, showing the accounting information system in communication with the external environment. The major components of accounting information systems flowchart are: entities, processes, data stores, and data flows. The set of standard accounting information flowchart symbols is intended to show the relationships between the system components. ConceptDraw PRO can help to draw clear accounting information system diagrams using special flowchart symbols.ConceptDraw PRO Database Modeling Software
ConceptDraw PRO is a very easy-to-use and intuitive database design tool which can save you hundreds of work hours. See database diagram samples created with ConceptDraw PRO database modeling database diagram software.
 ConceptDraw Solution Park
ConceptDraw Solution Park collects graphic extensions, examples and learning materials
- Entity Relationship Diagram Symbols and Meaning ERD Symbols ...
- Entity Relationship Diagram Symbols | Data Flow Diagram Symbols ...
- Database Flowchart Symbols | Basic Flowchart Symbols and ...
- Entity Relationship Diagram Symbols and Meaning ERD Symbols ...
- Components of ER Diagram | Entity Relationship Diagram Symbols ...
- Entity Relationship Diagram Software for Design Crows Foot ER ...
- Entity - Relationship Diagram (ERD) | Process Flowchart | Venn ...
- Basic Flowchart Symbols and Meaning | Entity Relationship ...
- Marketing Diagrams | Entity - Relationship Diagram (ERD) | Process ...
- Data Flow Diagrams | Entity Relationship Diagram Examples | Entity ...
- Basic Flowchart Symbols and Meaning | How To Draw Building ...
- Business Productivity Diagramming | Entity Relationship Diagram ...
- Process Flowchart | Structured Systems Analysis and Design ...
- Basic Flowchart Symbols and Meaning | Design elements - IDEF0 ...
- Process Flowchart | Entity - Relationship Diagram (ERD) | Entity ...
- Process Flowchart | Entity Relationship Diagram Symbols and ...
- Entity - Relationship Diagram (ERD) | Sales Process Flowchart ...
- Process Flowchart | Basic Flowchart Symbols and Meaning | Entity ...
- Process Flowchart | Value Stream Mapping | Entity Relationship ...
- Entity Relationship Diagram Symbols and Meaning ERD Symbols ...


