HR Management Software

Human Resource Development

Human Resource Management

Hiring Process

Identifying Quality Management System

Landscape Plan

House of Quality Matrix Software

Six Markets Model Chart

HR Flowchart Symbols

TQM Software — Build Professional TQM Diagrams

Sales Process Management

It is effective to use professional software for the sales process management. ConceptDraw PRO diagramming and vector drawing software extended with Sales Flowcharts solution from the Marketing area of ConceptDraw Solution Park is the best choice.
The vector stencils library "HR symbols" contains 45 HR pictograms.
Use this icon set with HR symbols to draw your HR flowcharts, workflow diagrams, process charts and infographics with the ConceptDraw PRO diagramming and vector drawing software.
The HR pictograms library "HR symbols" is included in the HR Flowcharts solution from the Management area of ConceptDraw Solution Park.
Absence management

Absenteeism

Achievement

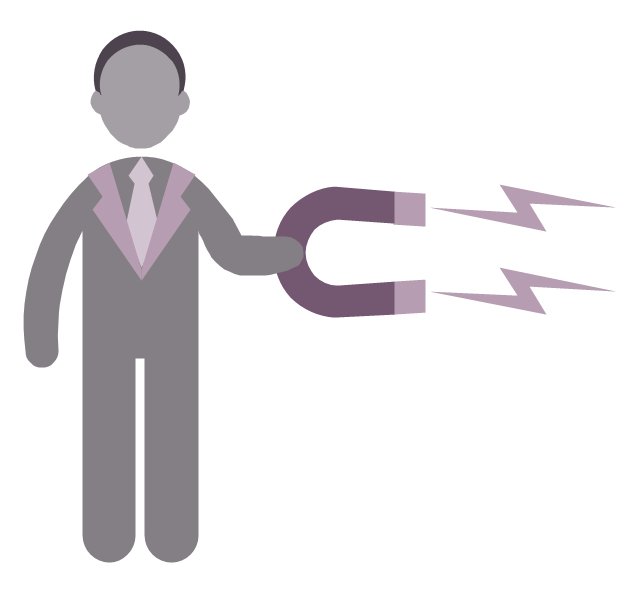
Attract
Authority and accountability

Business goals

Business success

Capital formation

Career

Career ladder

Communication

Compensation management

Conflict management

Conformance

Dress code

Education

Global HR

Headhunting

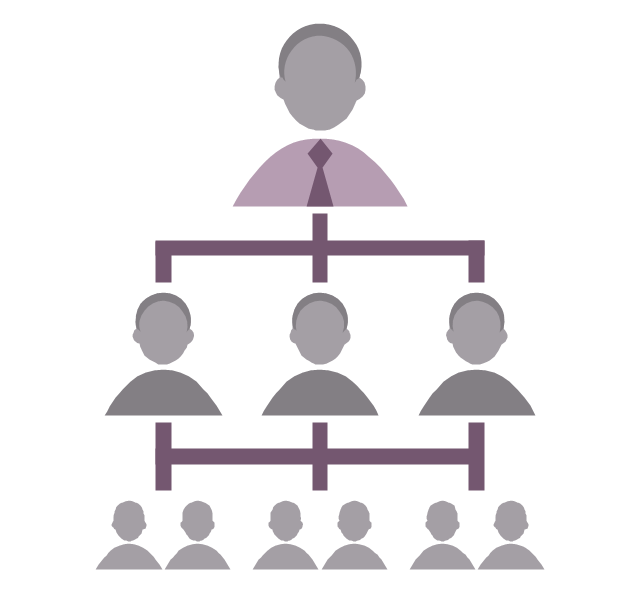
Hierarchical organization
Human capital

Human resource management

Incentive compensation management

Increase productivity

Job performance

Job satisfaction

Labor Unions

Leadership

Motivation and incentives

Organizational culture

Partnership

Performance management

Problem solving

Retention

Skill

Smart ideas

Staff turnover

Succession management

Talent acquisition

Time efficiency

Time management

Timekeeping

Winner

Workforce planning

Workplace culture

Workplace health and safety

How to Draw EPC Diagram Quickly
Diagram (Win, Mac)")

This example was created on the base of the Georgia DOT Performance Management Dashboard from the Georgia Department of Transportation website.
[dot.ga.gov/ informationcenter/ statistics/ performance/ Pages/ default.aspx]
"Performance management (PM) includes activities which ensure that goals are consistently being met in an effective and efficient manner. Performance management can focus on the performance of an organization, a department, employee, or even the processes to build a product of service, as well as many other areas.
PM is also known as a process by which organizations align their resources, systems and employees to strategic objectives and priorities.
Performance management originated as a broad term coined by Dr. Aubrey Daniels in the late 1970s to describe a technology (i.e. science imbedded in applications methods) for managing both behavior and results, two critical elements of what is known as performance. A formal definition of performance management, according to Daniels' is "a scientifically based, data-oriented management system. It consists of three primary elements-measurement, feedback and positive reinforcement."" [Performance management. Wikipedia]
The meter dashboard example "Georgia DOT Performance Management" was created using the ConceptDraw PRO diagramming and vector drawing software extended with the Meter Dashboard solution from the area "What is a Dashboard" of ConceptDraw Solution Park.
Meter dashboard

Fishbone Diagram Problem Solving

- Employee Performance Png
- Employee Performance Icon Png
- Employee Steps Vector
- HR symbols - Vector stencils library | Icons Employee Absent
- Performance Vector Png
- Employee Incentive Icon Png
- Employee Vector Images
- Performance Appraisal Report Vector Png
- HR symbols - Vector stencils library | HR Flowchart Symbols | HR ...
- Job Performance
- Use the Best FlowChart Tool for the Job | HR workflow - Vector ...
- Fear Vector
- Talent And Performance Diagram
- Performance Management Png
- Employee distribution - HR dashboard | Frequency Distribution ...
- Employee Development Vector
- HR workflow - Vector stencils library | HR Flowcharts | Hiring ...
- Ms Visio Hr Vector
- HR workflow - Vector stencils library | HR workflow - Vector stencils ...
- Employee Benefits Vector Png