Bar Diagrams for Problem Solving. Create economics and financial bar charts with Bar Graphs Solution

Sales Growth. Bar Graphs Example

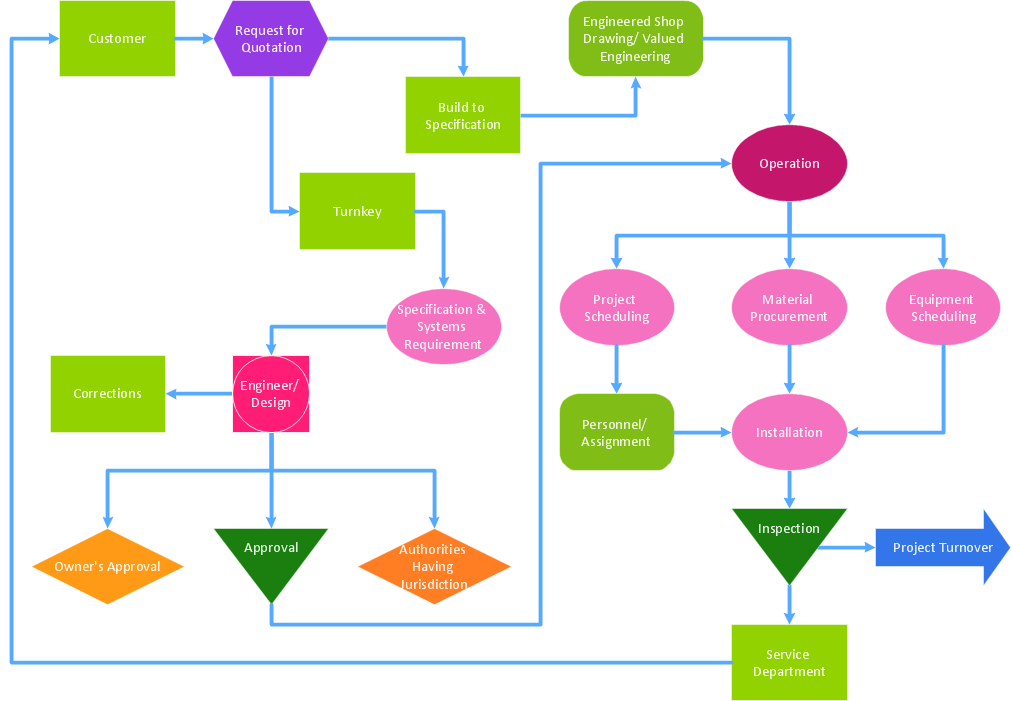
Flowchart Software


Bar Diagrams for Problem Solving. Create manufacturing and economics bar charts with Bar Graphs Solution

Total Quality Management Value

Best Value — Total Quality Management
Stakeholder Onion Diagrams

Typography Font
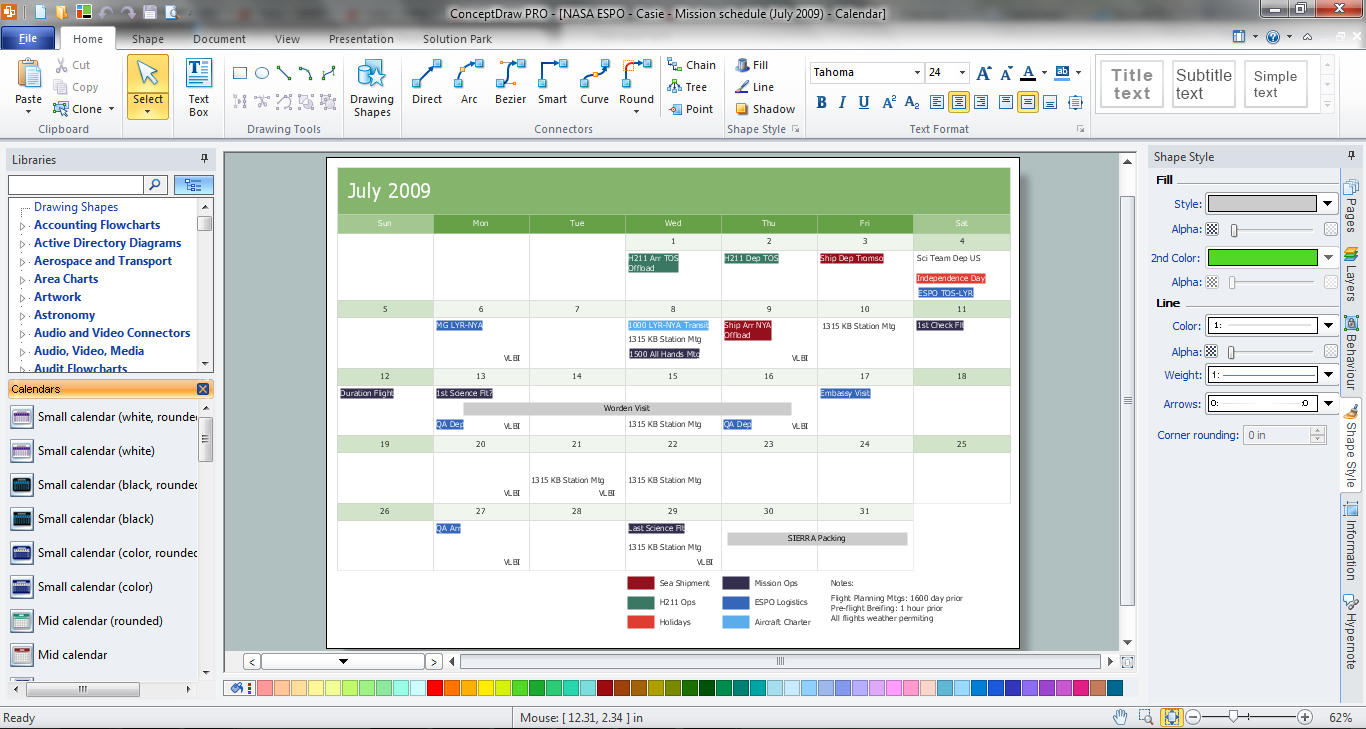
Economic Calendar
Column Chart Template

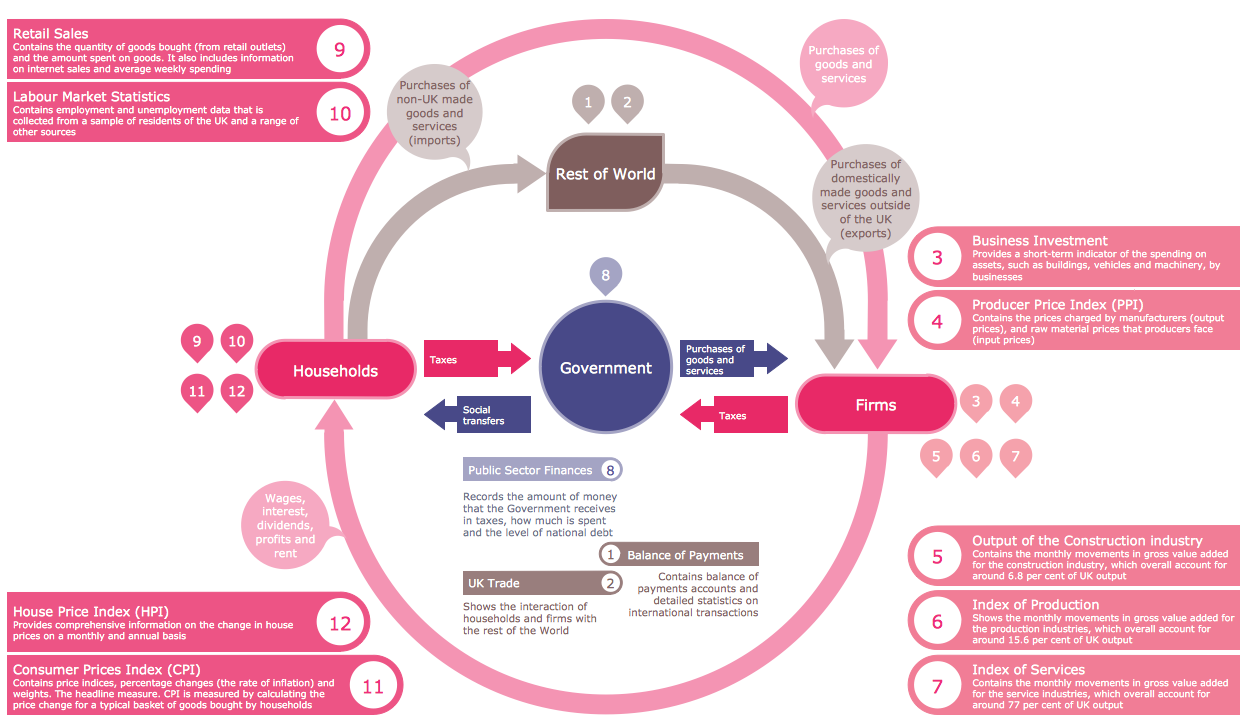
- Sector diagram - Template | Economic sector weightings | New ...
- Economic sector weightings | Pie Chart Examples and Templates ...
- Target and Circular Diagrams | Circle-Spoke Diagrams | Venn ...
- Economic sector weightings | Iron And Steel Industries Pie Chart
- Blank Calendar Template | Business Calendar | Economic Calendar ...
- Economic sector weightings | Stakeholder Onion Diagrams | Color ...
- Flow Chart And Piechart In Software Development Economic Sector
- Economic sector weightings | In What Economy Sector Does A ...
- France exports of goods and services | Economic Calendar
- Blank Calendar Template | Business Calendar | Economic Calendar ...