Example 1. Economic Calendar in ConceptDraw DIAGRAM
Design of economic calendar or financial calendar, what can be easier with ConceptDraw DIAGRAM and its Calendars Solution?
Calendars Solution offers the extensive drawing tools, collection of predesigned templates, samples and examples, and also the Calendars library with numerous vector objects for quick and easy design calendars.

Example 2. Calendars Library Design Elements
Use of ready vector object is the easiest way of drawing. Simply drag the ready calendar's object which corresponds to your needs and then fill it with own data? Try yourself and verify that it's very fast and easy.

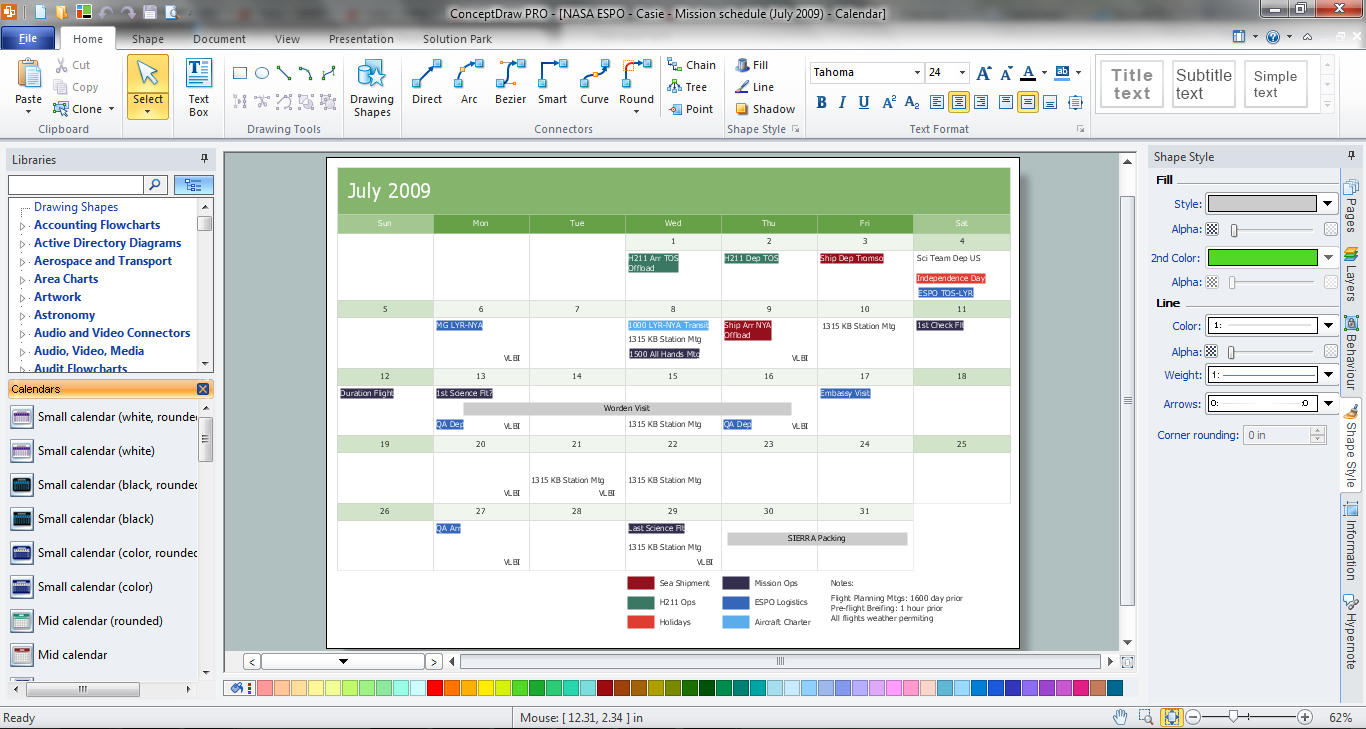
Example 3. NASA ESPO Casie Mission Schedule July 2009
This sample was created in ConceptDraw DIAGRAM using the predesigned calendar object from the Calendars library and shows the detailed monthly calendar of the NASA ESPO Casie Mission at the July 2009. An experienced user spent 15 minutes creating this sample.
Use Calendars solution to create your own professional looking and attractive calendars quick, easy and effective.
The Economic Calendar designed with ConceptDraw DIAGRAM is a vector graphic documents and is available for reviewing, modifying, converting to a variety of formats (image, HTML, PDF file, MS PowerPoint Presentation, Adobe Flash or MS Visio), printing and send via e-mail in one moment.
THREE RELATED HOW TO's:
Describing the way data flows through an information system might become a subject of a study. One of the kinds on a data flow diagram is called Gane Sarson Diagram after its authors, and it slightly differs from other notations. Process symbols in this notation are depicted as rounded rectangles connected with arrows representing data flows.
This is a sample of data flow diagram. It demonstrates utilization of the Gane-Sarson notation for making DFD on the example of an online appointment system of the Health Centre. This sample is used the vector objects library of Gane-Sarson DFD notation supplied by the ConceptDraw solution for data flow diagramming. It contains all symbols of the Gane-Sarson notation including connectors, jumps, and processes. This solution can be successfully utilized to generate DFDs for business documentation, and presentations.
Picture: Gane Sarson Diagram
For depicting the onion model are actively used Stakeholder Onion Diagrams. The ConceptDraw DIAGRAM diagramming and vector drawing software extended with Stakeholder Onion Diagrams Solution from the Management Area of ConceptDraw Solution Park offers the number of useful tools and Stakeholder Onion Diagram template for their easy design.
Picture: Stakeholder Onion Diagram Template
Related Solution:
Describing a workflow or approval process can take hours and be too complicated, especially since there are options to do it quickly and vividly. Diagrams called flowcharts replace long paragraphs of boring text and represent information in a graphic way. You can draw one on paper or you can use flowchart software to do it quickly and scalable. This kind of software is easy to use and you don’t need any special skills to start using it. In addition, there are a lot examples and predesigned templates on the Internet.
Flowcharts are a best tool for staking out a huge and complex process into some small readable parts. Surely, flowcharts can be drawn manually but the use of standard symbols that make it clear for a wide audience makes a software tool preferred for this task. The core for a successful flowchart is its simplicity. That is why often before beginning making flowchart through software, people draw the sketch on a piece of paper. Designing an effective flowchart means the combination of the data needed to be shown and the simplicity with which you depict it.
Picture: Flowchart Software: A Comprehensive Guide
Related Solution:

