This site uses cookies. By continuing to browse the ConceptDraw site you are agreeing to our Use of Site Cookies.
HelpDesk

How to Create a Gantt Chart for Your Project

Instruction on how to create Gantt chart using ConceptDraw PROJECT software.
Gant Chart is a graphical representation of tasks as segments on a time scale. It helps plan or overlapping.

How to Discover Critical Path on a Gantt Chart

ConceptDraw PROJECT is the Gantt chart software that implements critical path method to provide the user with a wide set of project management tools.

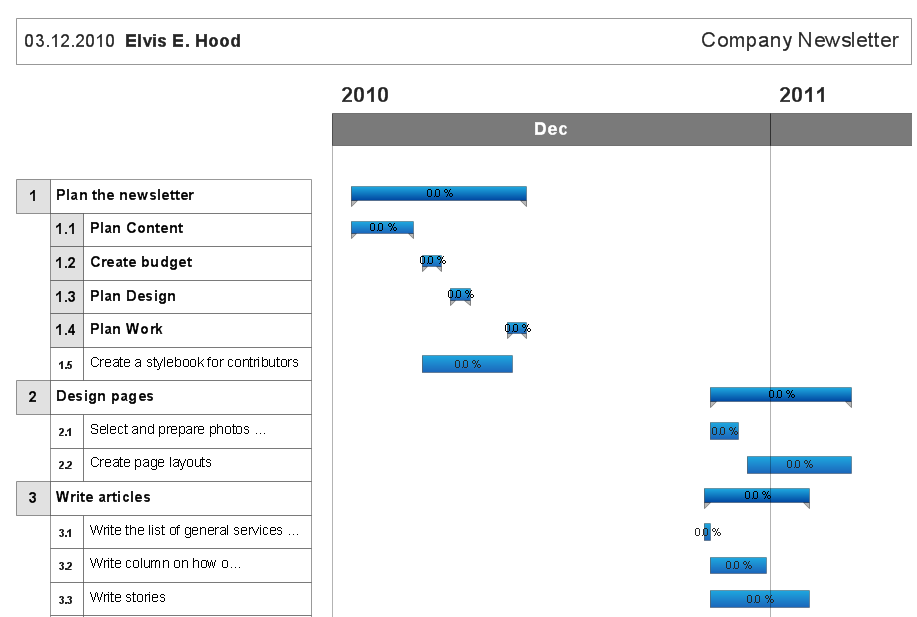
How to Create Gantt Chart

To begin managing a new project, you will need to define the individual Tasks that must be completed to deliver it. The default view for a new project in ConceptDraw PROJECT is the Gantt Chart.

How to Create Presentation of Your Project Gantt Chart

During the planning, discussing and execution of a project you may need to prepare a presentation using project views such as the Gantt Chart, Multiproject Dashboard or Resource Usage View. It’s easy do with ConceptDraw PROJECT!

Chore charts with ConceptDraw DIAGRAM

Chore chart. Draw perfect-looking chore chart. Free chore chart samples. All about chore charts.

PERT Chart Software

PERT Chart Software - Activity Network and Project Evaluation and Review Technique, or PERT, charts are a way of documenting and analyzing the tasks in a project.
ConceptDraw DIAGRAM is a powerful diagramming and vector drawing software for designing professional looking PERT Charts quick and easy.
HelpDesk

How to Shift Dates in ConceptDraw PROJECT

A way to shift all dates in a project a specified period, so you can use old project schedules as a template for new schedules

How to Report Task's Execution with Gantt Chart

ConceptDraw PROJECT’s powerful reporting engine lets you generate a set of tabular reports with just one click, or visualize your project as Radial Tasks Structures, Work Breakdown Structures and Resource Calendars. It also provides you with dynamic Project Dashboards.

Gantt Chart Software

The Gantt Chart is the main interface in ConceptDraw PROJECT. It summarizes the tasks in your project and presents them graphically so you can easily view your progress.

Gantt Chart Diagram

PM Made Easy allows you to plan and execute projects using mind mapping techniques, implement planning using mind mapping, and track tasks using CD Project.