How to Discover Critical Path on a Gantt Chart

HelpDesk
What Information to be Displayed in the ConceptDraw PROJECT Gantt Chart View

HelpDesk
How to Operate with Project Time Frames in ConceptDraw PROJECT

Program Evaluation and Review Technique (PERT) with ConceptDraw DIAGRAM

Program Evaluation and Review Technique (PERT) with ConceptDraw DIAGRAM
Collaboration in a Project Team

How to Report Task's Execution with Gantt Chart

 Scrum Workflow
The Scrum Workflow Solution extends the capabilities of ConceptDraw DIAGRAM with a large collection of professionally-designed samples and a selection of ready-to-use scrum design elements: scrum diagrams and arrows, scrum icons of people, artifacts, workflow, workspace and other colorful scrum clipart, and also scrum charts.
Total Quality Management Value

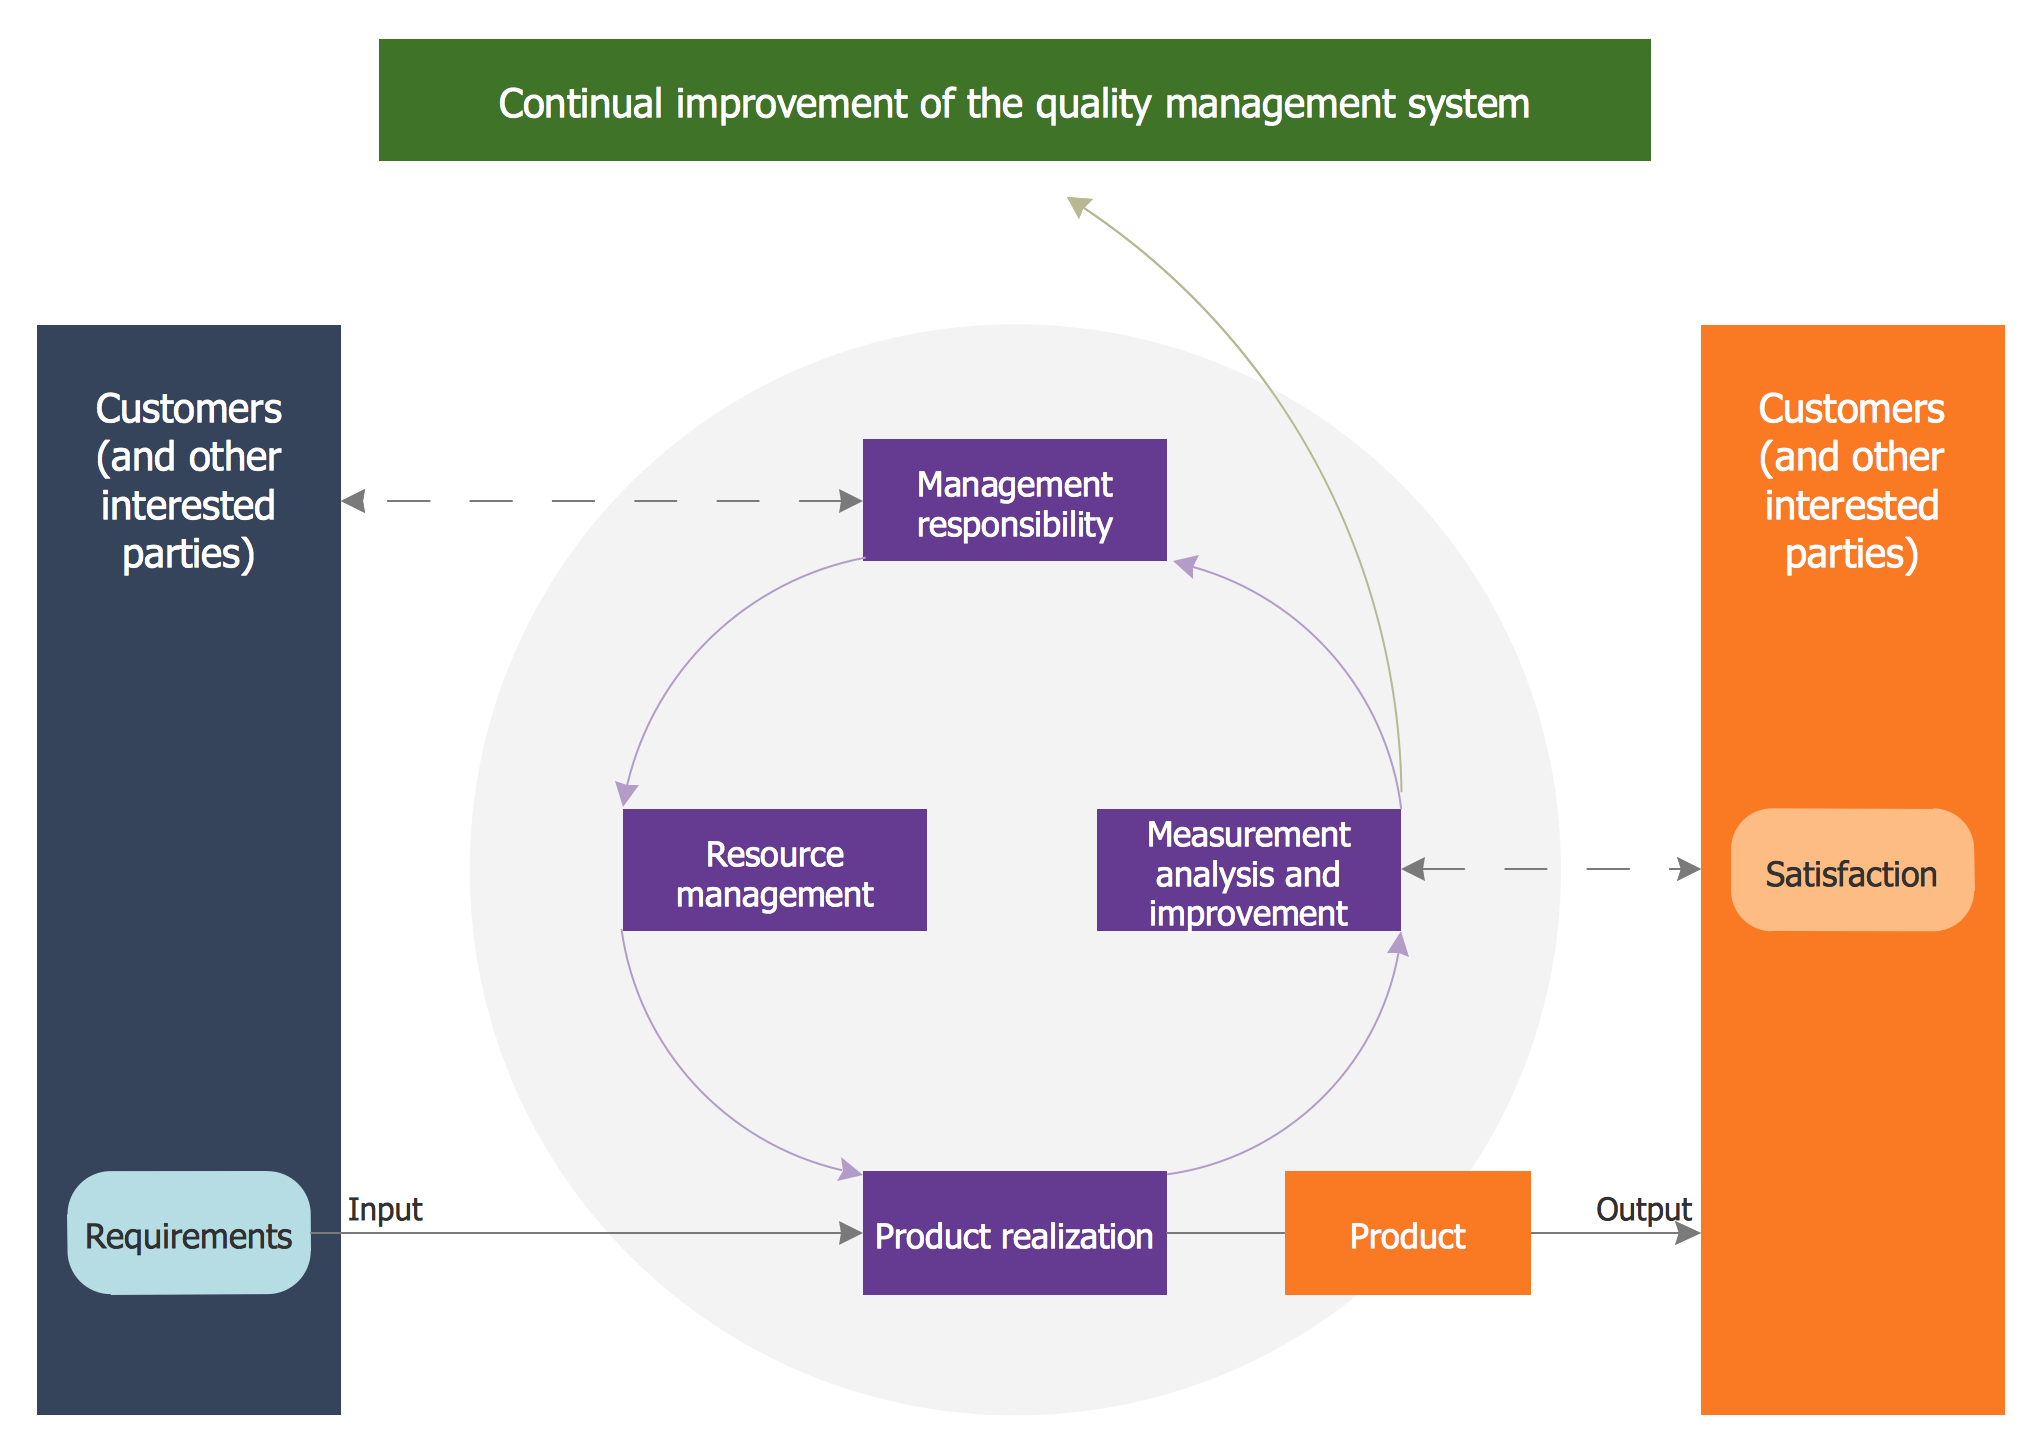
Quality Management System
- Gantt Chart Early Start Late Start
- Early Start Early Finish Network Diagram
- Critical Path For Complex Project
- Online Project Management System
- Project Reports — Visual Reports
- How To Create a PERT Chart | PERT chart - Template | PERT chart ...
- PERT chart - Template | Seven Management and Planning Tools ...
- HR management process - Flowchart | Audit flowchart - Project ...
- History