Project Reports — Visual Reports
The diagrams and graphs are a clear and illustrative way of representing different information, data, ratios of values forming a single unity. There are many kinds of graphs and charts, which find their application in varied fields and spheres of activity, including the field of project management. For each type of information its own the most suitable visualization tool is used. A visual analysis of diagrams is a simplest, but highly effective planning and project management tool, convenient to obtain the answers to many questions concerning the project and its implementation.
Gantt chart is the most common tool of project management, it graphically represents the timeline project plan, a schedule of works for the project and degree of its completion. Various types of diagrams and graphs are also popular when making the reports on a project. A simple graph or chart is able to tell better about the project status than several pages of text or a strict table of quantitative data. Varied graphs and diagrams make your reports more lively, understandable, visual and attractive, contribute to better perception and memorization of information. In this regard, their use in reports is always justified and beneficial.
Pic 1. Project Reports — Visual Reports
ConceptDraw PROJECT software allows visualizing your reports, creating different kinds of reports using the graphs and charts, such as Bar Charts, Divided Bar Charts, Pie Charts, Line Charts, Timelines, Dial Dashboards. These diagrams transform quantitative data from a Gantt Chart in a convenient and clear graphical form, the bright color indicators are used to specify the statuses of projects or individual tasks. The vivid graphics are more interesting and attract attention easily. Such report will be perceived with great interest by any audience and it is able to evoke more emotions and responses, than the report in a strict tabular form.
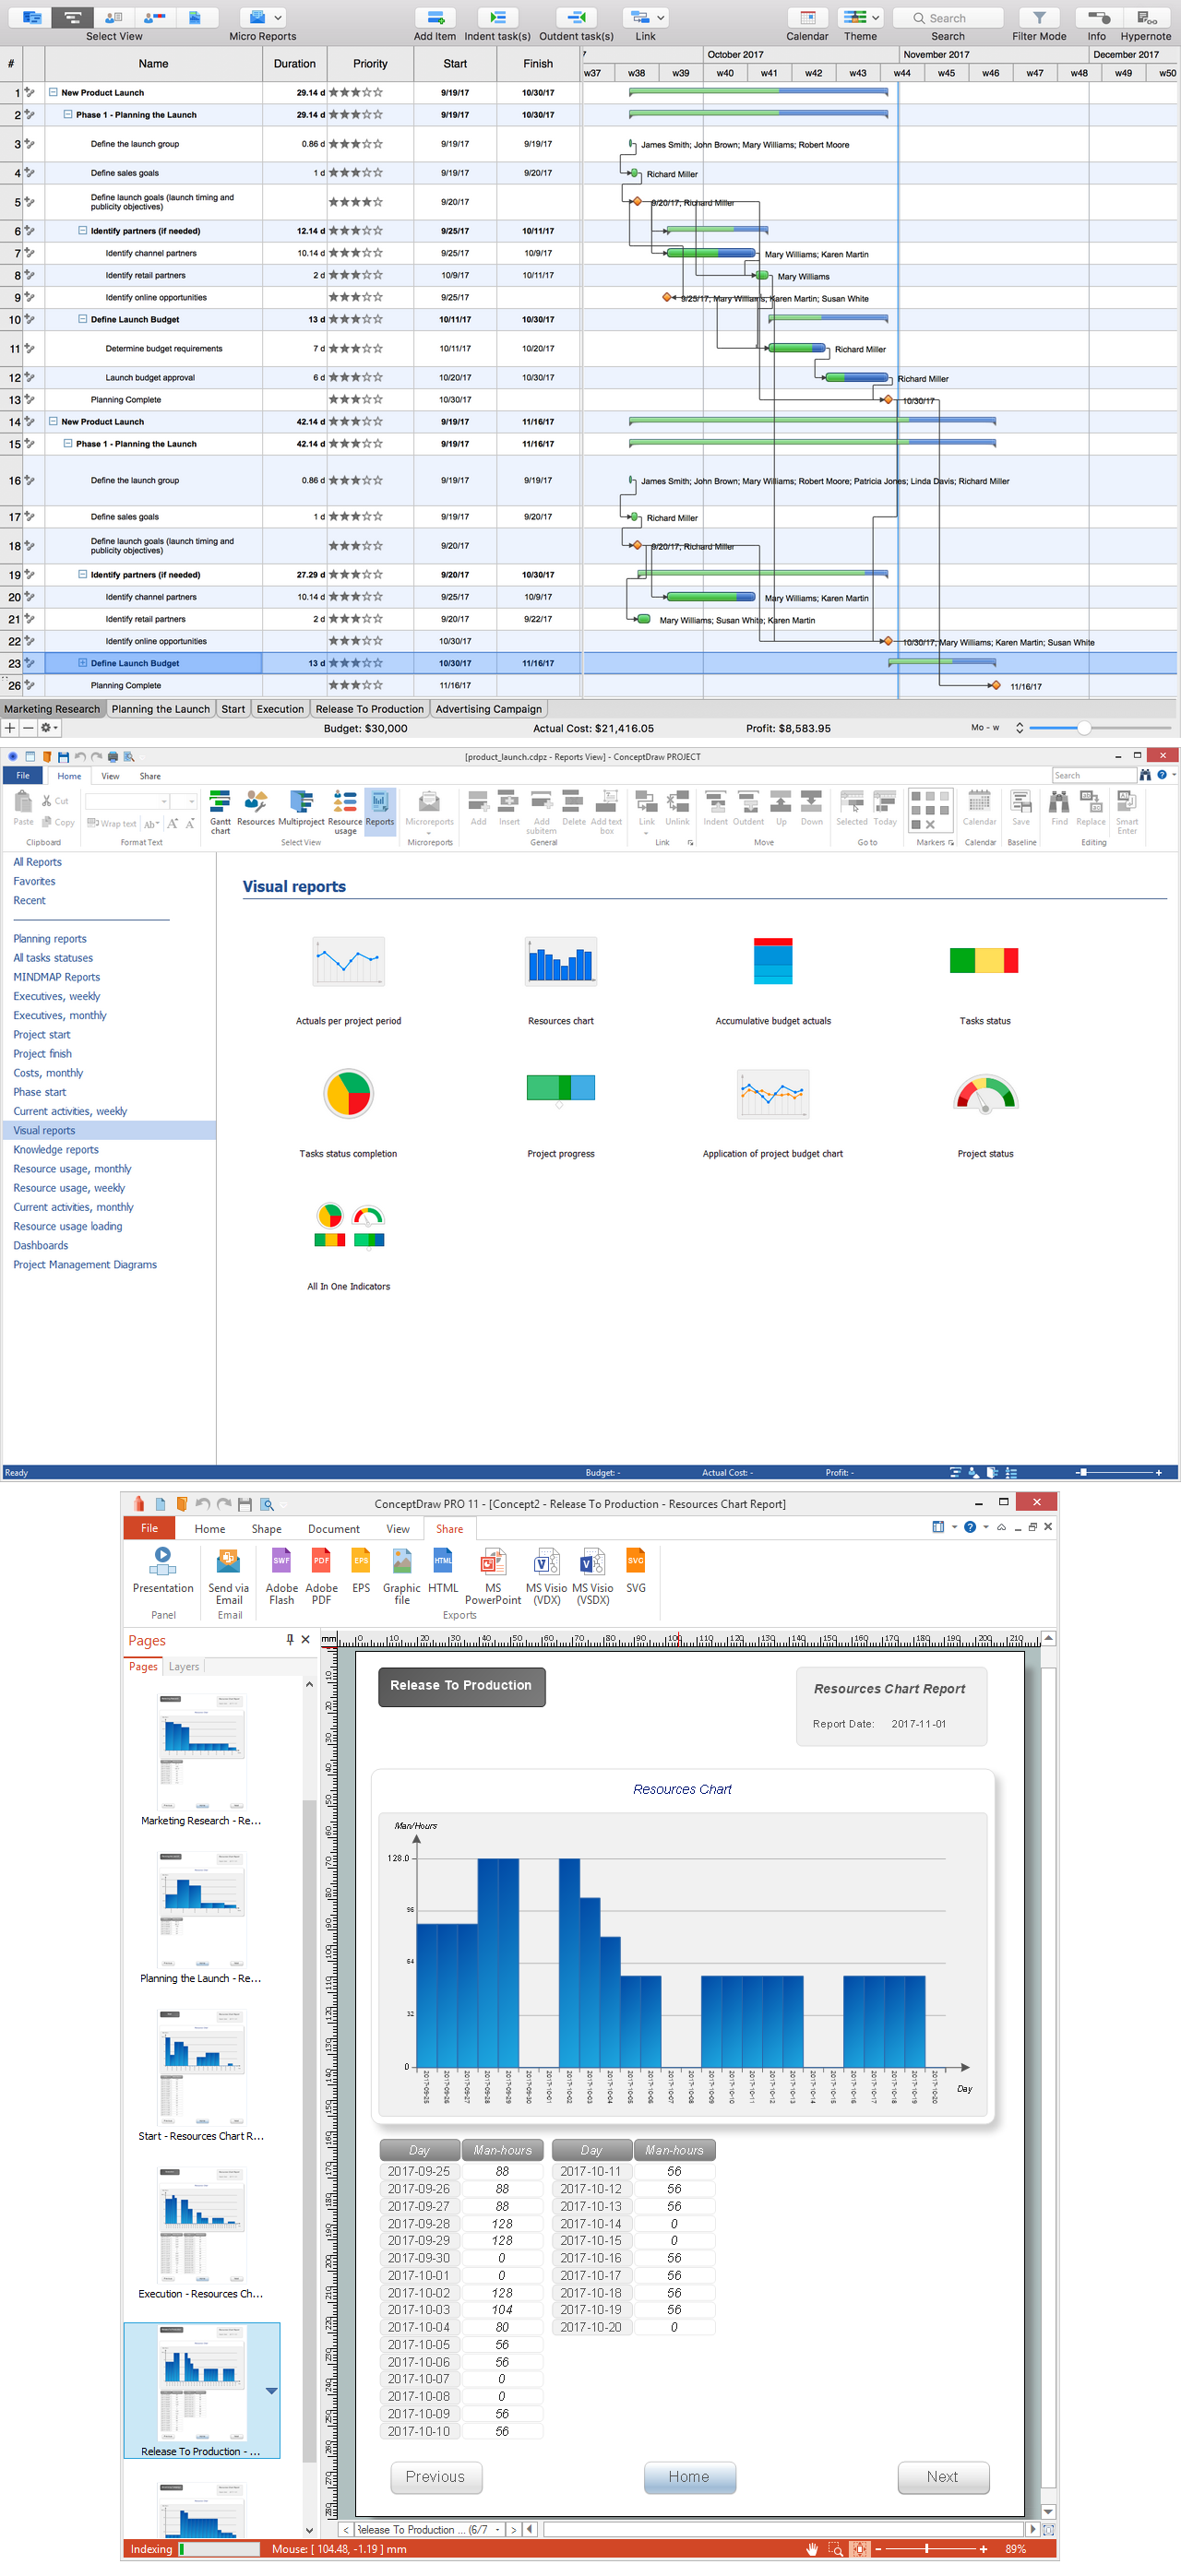
The group of “Visual reports” templates is available from the Reports drop-down list on the Reports toolbar in ConceptDraw PROJECT It provides the following types of reports:
- Actuals per project period
- Resources chart
- Accumulative budget actuals
- Tasks status
- Tasks status completion
- Project progress
- Application of project budget chart
- Project status
- All In One Indicators.
The "Actuals per project period" item lets generate the report with actuals per project for the reporting period, it displays the table of expenses by days and a visual graph. The "Resources chart" item generates the report with a table of data according to the resource utilization in a project by days and gives a visual representation of this information in a form of Resources chart.
The "Accumulative budget actuals" item allows creating the report with accumulative budget actuals, which shows the project expenses by days, compares them with budgeted amounts and visually highlights the days that go beyond the budget.
The "Tasks status" item generates the report about the tasks statuses and lets compare the quantities of completed tasks, the tasks in progress and unstarted tasks. The "Tasks status completion" item lets represent the quantities of on time tasks, the early completed and late tasks as the parts of corresponding size on a Pie Chart, each group is visually highlighted with its own color.
The "Project progress" item generates the report about the project progress and degree of completion. The "Application of project budget chart" item lets represent actual and planned values, and to compare them.
The "Project status" item lets generate the report with evaluation the project status and to define instantly the affiliation for a certain category. The "All In One Indicators" item generates the report that gives the versatile representation of data per project and joins four different diagrams in one.
Select the type of report that meets your needs, the report diagram will be generated and automatically opened in ConceptDraw DIAGRAM software. The generated graphs clearly reflect quantitative data on the project and their ratios, help to assess effectively the current situation in a project and to monitor the project implementation.