Business Diagram Software
When managing the projects, people, or networks, there are daily designed and used different types of Business diagrams, so the powerful drawing software will be very useful for this. ConceptDraw DIAGRAM with large quantity of business solutions will meet your needs and will help you convey your ideas successful and rapidly, no matter are you professional or beginner. It is the best choice for business specialists and technical professionals who need quickly and easily explore, visualize, and communicate information. ConceptDraw DIAGRAM business diagram software is the most powerful business software and relational charting software. Create advanced, completely customizable Business Process Diagrams, Business Flow Charts, Work Flow Diagrams, Organizational Charts, Audit diagrams, Marketing diagrams, Value Stream Maps, TQM diagrams, ERD diagrams, EPC diagrams, Cause and Effect diagrams, Infographics, Dashboards, and other Relational business diagrams from your data using the powerful drawing tools of ConceptDraw Solution Park.
ConceptDraw Arrows10 Technology
When using a shapes′ center connection the connection becomes dynamic, the connector will trace the contour of the object, when moving the object inside your diagram. Using any other connection point provides a static connection, when you move connected objects the connector stays attached to the same point.Gantt Chart Templates
Gantt Chart Templates - PM Easy Solution from the Project Management Area extends ConceptDraw PROJECT with the ability to quickly start a project. It lists task dependencies and relationships making the terative planning easy. ConceptDraw PROJECT lets you the useful possibility to create visual project dashboards and diagrams, generate various kinds of reports with one click. It provides also extensive capabilities of importing and exporting in various formats: Microsoft Project, ConceptDraw MINDMAP , Mindjet MindManager, PDF file.HelpDesk
How to Perform a Presentation on Mac Using Two Monitors
ConceptDraw DIAGRAM supports multiple monitors. You can to edit a presentation and then display it on separate monitors.
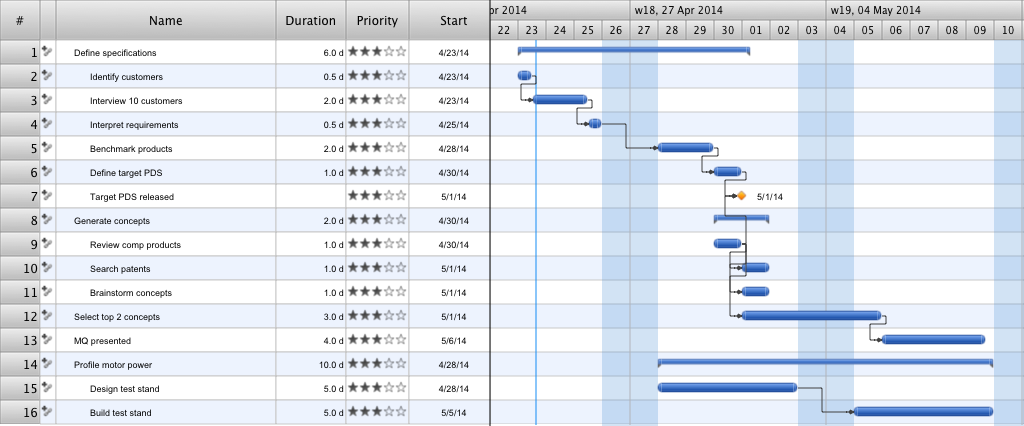
How to Report Task's Execution with Gantt Chart
ConceptDraw PROJECT’s powerful reporting engine lets you generate a set of tabular reports with just one click, or visualize your project as Radial Tasks Structures, Work Breakdown Structures and Resource Calendars. It also provides you with dynamic Project Dashboards.Gantt chart examples
All Gantt charts were made using ConceptDraw PROJECT. ConceptDraw PROJECT works both on Windows and Mac OS X. It allows to schedule a voluntary number of projects in a single Workspace document and lets easily share tasks and resources among them. ConceptDraw PROJECT shares files among Windows and Mac OS X.HelpDesk
How to Perform a Dynamic Presentation
ConceptDraw DIAGRAM document can be displayed as a dynamic interactive presentation. You can select presentation options using a Presentation panel. And even during presentation performance, you can make it accurate and up to date in a moment: edit the document by making changes, adding comments. ConceptDraw DIAGRAM allows you to save a presentation as a slide show that opens immediately in a full-screen. Any ConceptDraw presentation can be performed in three ways; manually, automatic slide-show, and cyclic-playing mode.Gantt Chart Software
ConceptDraw PROJECT is a powerful Gantt Chart Software. The Gantt Charts are useful for displaying a large amount of detailed information, project tasks and timelines in a visually pleasing, easy-to-understand format. ConceptDraw PROJECT provides wide capabilities of importing and exporting in various formats: Microsoft Project, ConceptDraw MINDMAP , Mindjet MindManager, PDF file.Venn Diagram Examples for Problem Solving. Computer Science. Chomsky Hierarchy
A Venn diagram, sometimes referred to as a set diagram, is a diagramming style used to show all the possible logical relations between a finite amount of sets. In mathematical terms, a set is a collection of distinct objects gathered together into a group, which can then itself be termed as a single object. Venn diagrams represent these objects on a page as circles or ellipses, and their placement in relation to each other describes the relationships between them. The Venn diagram example below visualizes the the class of language inclusions described by the Chomsky hierarchy.ConceptDraw PROJECT Software Overview
ConceptDraw PROJECT is an effective tool for new and experienced users with a fine balance of usability and powerful functionality.
PM Dashboards
The PM Dashboards solution extends the management boundaries of ConceptDraw DIAGRAM and ConceptDraw PROJECT products with an ability to demonstrate changes to the budget status, to show the project progress toward its objectives, to display clearly the identified key performance indicator (KPI) or the set of key performance indicators for any project. This solution provides you with examples and ability to generate three types of visual dashboards reports based on your project data Project Dashboard, Tactical Dashboard, and Radar Chart. By dynamically charting the project’s key performance indicators that are collected on one ConceptDraw DIAGRAM document page, all project participants, project managers, team members, team leaders, stakeholders, and the entire organizations, for which this solution is intended, have access to the daily status of projects they are involved in.
Competitor Analysis
Competitor analysis is a first and obligatory step in elaboration the proper corporate marketing strategy and creating sustainable competitive advantage. Use powerful opportunities of numerous solutions from ConceptDraw Solution Park for designing illustrative diagrams, charts, matrices which are necessary for effective competitor analysis.Gantt charts for planning and scheduling projects
ConceptDraw PROJECT is an excellent simple project scheduling software. It maintain classic project gantt charts and the line of professional reports on resources usage. It include handy critical path scheduling software tools and diagraming tools which helps prepare the presentation of project status. It include project tracking dashboard to keep project metrics upto date, also it have handy feature to export project management dashboard in excel file.- 
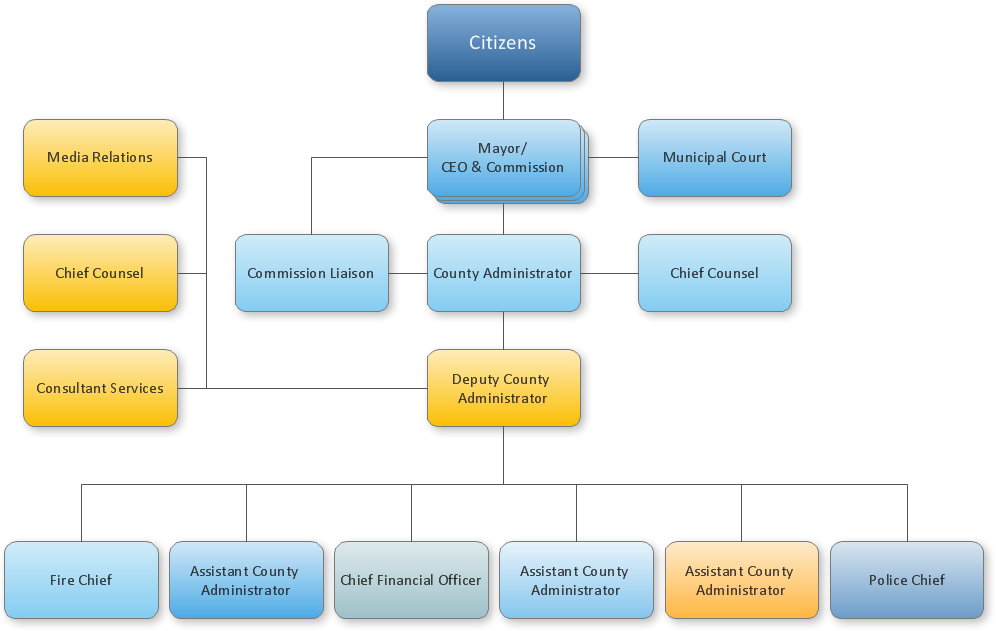
Dynamic Org Chart Excel
- Organizational Chart | Organizational Structure | How to Draw an ...
- How to Draw an Organization Chart | How to Draw a Bubble Chart ...
- How to Draw an Organization Chart | How to Create Organizational ...
- Pyramid Diagram | How to Draw a Flat Organizational Chart with ...
- Organizational chart - University leadership | SWOT analysis for a ...
- Matrix Organization Structure | Basic Flowchart Symbols and ...
- How to Draw an Organization Chart | Organizational chart - County ...
- Organizational Chart With Pictures Database
- Organizational Charts | Basic Flowchart Symbols and Meaning ...
- How to Draw an Organization Chart | Project —Task Trees and ...
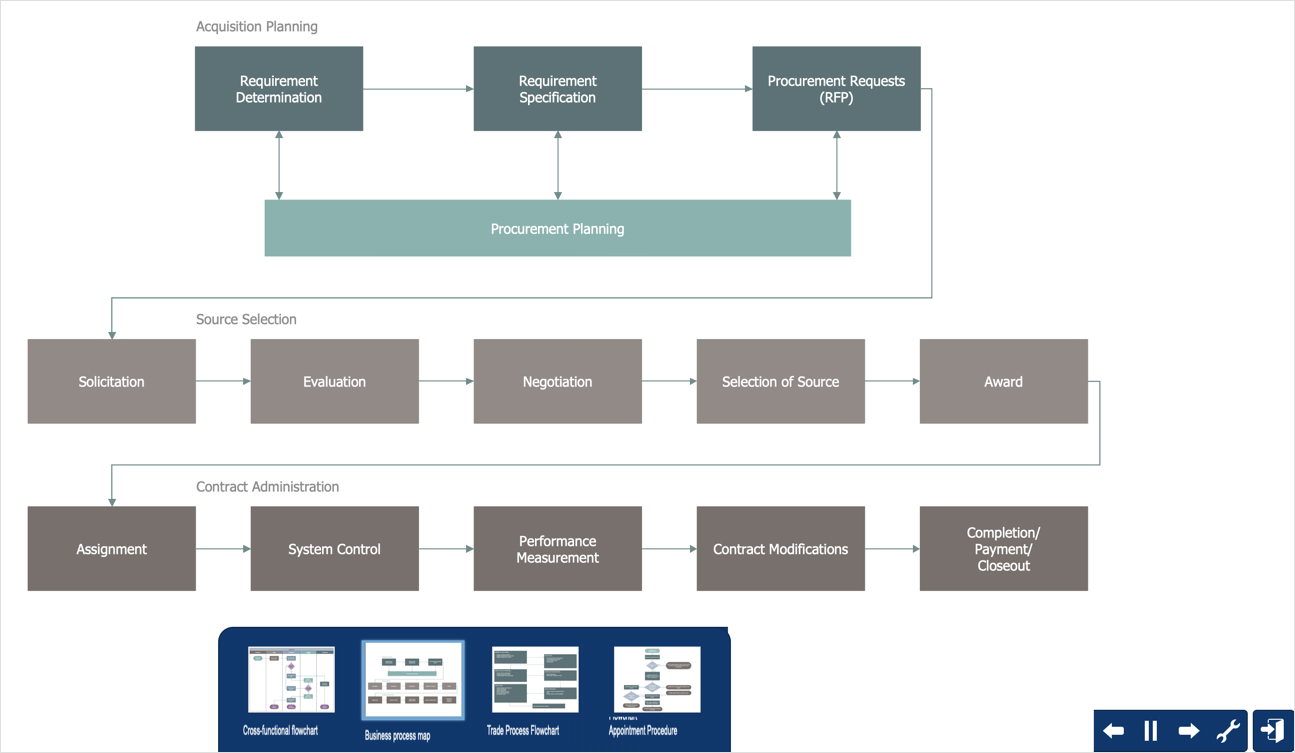
- Process Flowchart | Gantt chart examples | How to Report Task's ...
- Diagram Software - The Best Choice for Diagramming | Example of ...
- Organizational Chart | Organizational Structure | How to Draw an ...
- Decision Making | ConceptDraw PRO - Organizational chart ...
- Business Project Charts
- Auto Generate Corporate Structure
- Organizational Structure | How to Draw an Organization Chart ...
- Gantt chart examples | Gant Chart in Project Management | Gantt ...